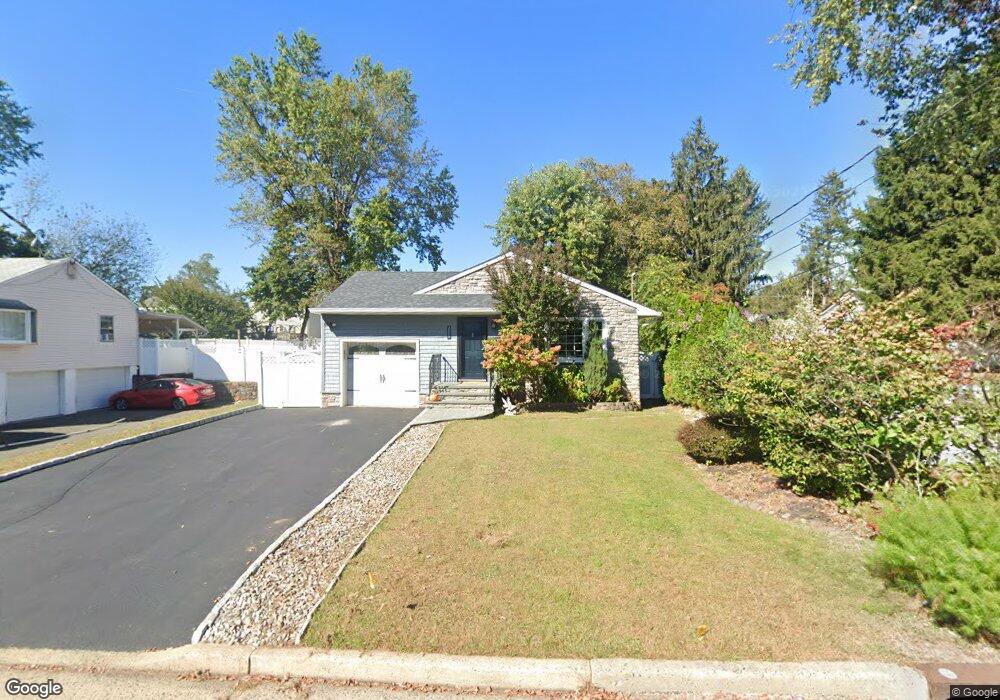
1116 S 10th St South Plainfield, NJ 07080
Estimated Value: $574,000 - $644,000
--
Bed
--
Bath
1,225
Sq Ft
$494/Sq Ft
Est. Value
About This Home
This home is located at 1116 S 10th St, South Plainfield, NJ 07080 and is currently estimated at $605,395, approximately $494 per square foot. 1116 S 10th St is a home located in Middlesex County with nearby schools including South Plainfield High School, The Queen City Academy Charter School, and Koinonia Academy.
Ownership History
Date
Name
Owned For
Owner Type
Purchase Details
Closed on
Oct 9, 2024
Sold by
Ullrich Andrew D and Ullrich Ewa
Bought by
Chee Kun and Chee Julie
Current Estimated Value
Home Financials for this Owner
Home Financials are based on the most recent Mortgage that was taken out on this home.
Original Mortgage
$345,000
Outstanding Balance
$336,910
Interest Rate
6.35%
Mortgage Type
New Conventional
Estimated Equity
$268,485
Purchase Details
Closed on
Jan 10, 2002
Sold by
Evans Gary
Bought by
Ullrich Andrew and Ullrich Ewa
Home Financials for this Owner
Home Financials are based on the most recent Mortgage that was taken out on this home.
Original Mortgage
$194,750
Interest Rate
7.13%
Purchase Details
Closed on
Jan 21, 1994
Sold by
Newman Gary
Bought by
Evans Gary and Halma Linda
Home Financials for this Owner
Home Financials are based on the most recent Mortgage that was taken out on this home.
Original Mortgage
$139,000
Interest Rate
7.08%
Create a Home Valuation Report for This Property
The Home Valuation Report is an in-depth analysis detailing your home's value as well as a comparison with similar homes in the area
Home Values in the Area
Average Home Value in this Area
Purchase History
| Date | Buyer | Sale Price | Title Company |
|---|---|---|---|
| Chee Kun | $575,000 | Westcor Land Title | |
| Chee Kun | $575,000 | Westcor Land Title | |
| Ullrich Andrew | $205,000 | -- | |
| Evans Gary | $146,000 | -- |
Source: Public Records
Mortgage History
| Date | Status | Borrower | Loan Amount |
|---|---|---|---|
| Open | Chee Kun | $345,000 | |
| Closed | Chee Kun | $345,000 | |
| Previous Owner | Ullrich Andrew | $194,750 | |
| Previous Owner | Evans Gary | $139,000 |
Source: Public Records
Tax History Compared to Growth
Tax History
| Year | Tax Paid | Tax Assessment Tax Assessment Total Assessment is a certain percentage of the fair market value that is determined by local assessors to be the total taxable value of land and additions on the property. | Land | Improvement |
|---|---|---|---|---|
| 2025 | $8,015 | $128,800 | $27,200 | $101,600 |
| 2024 | $7,666 | $114,800 | $27,200 | $87,600 |
| 2023 | $7,666 | $114,800 | $27,200 | $87,600 |
| 2022 | $7,571 | $114,800 | $27,200 | $87,600 |
| 2021 | $7,393 | $114,800 | $27,200 | $87,600 |
| 2020 | $7,285 | $114,800 | $27,200 | $87,600 |
| 2019 | $6,686 | $114,800 | $27,200 | $87,600 |
| 2018 | $6,513 | $114,800 | $27,200 | $87,600 |
| 2017 | $6,430 | $114,800 | $27,200 | $87,600 |
| 2016 | $6,365 | $114,800 | $27,200 | $87,600 |
| 2015 | $6,255 | $114,800 | $27,200 | $87,600 |
| 2014 | $6,075 | $109,800 | $27,200 | $82,600 |
Source: Public Records
Map
Nearby Homes
- 1122 S 10th St
- 1114 Clinton Ave
- 1117 S 9th St
- 1110 Clinton Ave
- 1200 Clinton Ave
- 1123 S 9th St
- 1204 Clinton Ave
- 1119 S 10th St
- 1126 S 10th St
- 1127 S 9th St
- 1208 Clinton Ave
- 1123 S 10th St
- 1131 S 9th St
- 1100 Clinton Ave
- 1133 S 9th St
- 1127 S 10th St
- 104 Elizabethtown Ct
- 1118 S 9th St
- 1122 S 9th St
- 100 Elizabethtown Ct