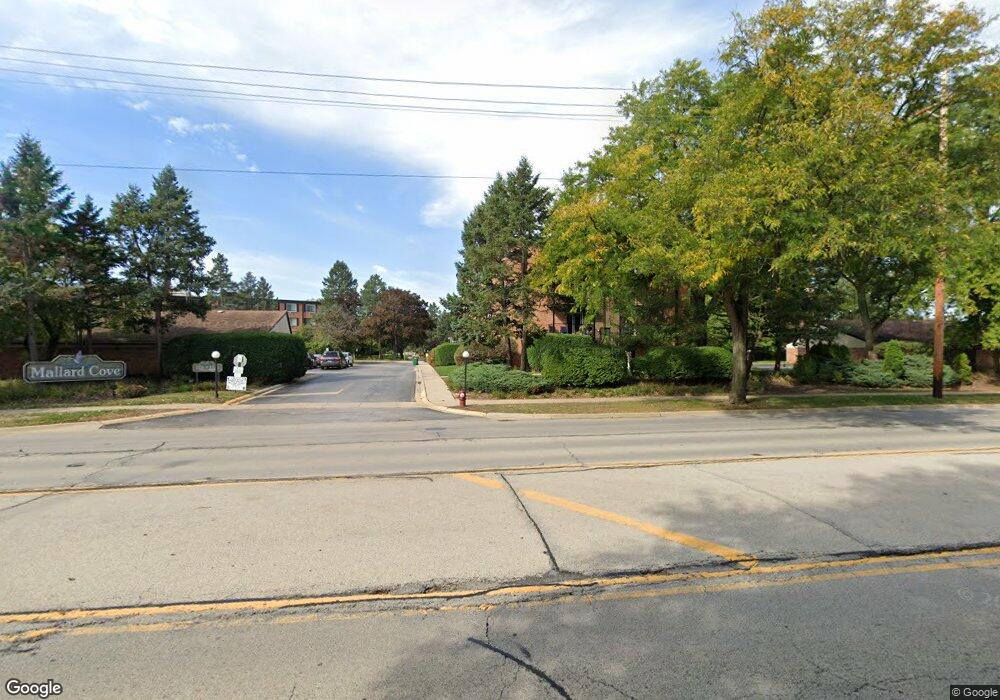
1116 S New Wilke Rd Unit 2104 Arlington Heights, IL 60005
Busse Woods NeighborhoodEstimated Value: $154,000 - $184,000
1
Bed
1
Bath
900
Sq Ft
$184/Sq Ft
Est. Value
About This Home
This home is located at 1116 S New Wilke Rd Unit 2104, Arlington Heights, IL 60005 and is currently estimated at $165,397, approximately $183 per square foot. 1116 S New Wilke Rd Unit 2104 is a home located in Cook County with nearby schools including Willow Bend Elementary School, Carl Sandburg Junior High School, and Rolling Meadows High School.
Ownership History
Date
Name
Owned For
Owner Type
Purchase Details
Closed on
Sep 20, 2024
Sold by
Tuchow Family Revocable Living Trust and Tuchow Randy J
Bought by
Ceca Bajram and Ceca Merita
Current Estimated Value
Purchase Details
Closed on
Jun 29, 2020
Sold by
Tuchow Randy J and Tuchow Tracy L
Bought by
Tuchow Randy J and Tuchow Tracy L
Purchase Details
Closed on
Mar 16, 2001
Sold by
Stavenhagen Peter F
Bought by
Tuchow Randy J
Home Financials for this Owner
Home Financials are based on the most recent Mortgage that was taken out on this home.
Original Mortgage
$81,200
Interest Rate
7.03%
Purchase Details
Closed on
Jun 23, 1998
Sold by
Mallard Cove Investors Llc
Bought by
Stavenhagen Peter F
Home Financials for this Owner
Home Financials are based on the most recent Mortgage that was taken out on this home.
Original Mortgage
$67,992
Interest Rate
7.27%
Create a Home Valuation Report for This Property
The Home Valuation Report is an in-depth analysis detailing your home's value as well as a comparison with similar homes in the area
Home Values in the Area
Average Home Value in this Area
Purchase History
| Date | Buyer | Sale Price | Title Company |
|---|---|---|---|
| Ceca Bajram | $145,000 | None Listed On Document | |
| Ceca Bajram | $145,000 | None Listed On Document | |
| Tuchow Randy J | -- | Attorney | |
| Tuchow Randy J | $101,500 | -- | |
| Stavenhagen Peter F | $85,000 | 1St American Title |
Source: Public Records
Mortgage History
| Date | Status | Borrower | Loan Amount |
|---|---|---|---|
| Previous Owner | Tuchow Randy J | $81,200 | |
| Previous Owner | Stavenhagen Peter F | $67,992 |
Source: Public Records
Tax History Compared to Growth
Tax History
| Year | Tax Paid | Tax Assessment Tax Assessment Total Assessment is a certain percentage of the fair market value that is determined by local assessors to be the total taxable value of land and additions on the property. | Land | Improvement |
|---|---|---|---|---|
| 2024 | $3,009 | $10,640 | $1,626 | $9,014 |
| 2023 | $2,883 | $10,640 | $1,626 | $9,014 |
| 2022 | $2,883 | $10,640 | $1,626 | $9,014 |
| 2021 | $2,577 | $8,341 | $1,066 | $7,275 |
| 2020 | $2,513 | $8,341 | $1,066 | $7,275 |
| 2019 | $2,526 | $9,350 | $1,066 | $8,284 |
| 2018 | $1,749 | $5,865 | $914 | $4,951 |
| 2017 | $730 | $5,865 | $914 | $4,951 |
| 2016 | $920 | $5,865 | $914 | $4,951 |
| 2015 | $898 | $5,643 | $812 | $4,831 |
| 2014 | $1,316 | $7,067 | $812 | $6,255 |
| 2013 | $1,266 | $7,067 | $812 | $6,255 |
Source: Public Records
Map
Nearby Homes
- 1127 S Old Wilke Rd Unit 403
- 1107 S Old Wilke Rd Unit 201
- 1117 S Old Wilke Rd Unit 206
- 1206 S New Wilke Rd Unit 108
- 1207 S Old Wilke Rd Unit 303
- 1217 S Old Wilke Rd Unit 11406
- 1227 S Old Wilke Rd Unit 12209
- 1227 S Old Wilke Rd Unit 306
- 1306 S New Wilke Rd Unit 2B
- 1602 W Orchard Place Unit 1602C
- 1322 S New Wilke Rd Unit 1C
- 2312 Algonquin Rd Unit 3
- 1860 W Surrey Park Ln Unit 1C
- 2508 Algonquin Rd Unit 16
- 1510 W Russell Ct
- 3805 Wren Ln
- 2402 Algonquin Rd Unit 9
- 2502 Algonquin Rd Unit 2
- 2504 Algonquin Rd Unit 14
- 2810 Northampton Dr Unit A2
- 1116 S New Wilke Rd Unit 110
- 1116 S New Wilke Rd Unit 103
- 1116 S New Wilke Rd Unit 210
- 1116 S New Wilke Rd Unit 206
- 1116 S New Wilke Rd Unit 2202
- 1116 S New Wilke Rd Unit 2107
- 1116 S New Wilke Rd Unit 2108
- 1116 S New Wilke Rd Unit G66
- 1116 S New Wilke Rd Unit G267
- 1116 S New Wilke Rd Unit G253
- 1116 S New Wilke Rd Unit 2210
- 1116 S New Wilke Rd Unit G266
- 1116 S New Wilke Rd Unit 2401
- 1116 S New Wilke Rd Unit G274
- 1116 S New Wilke Rd Unit 2204
- 1116 S New Wilke Rd Unit G294
- 1116 S New Wilke Rd Unit G286
- 1116 S New Wilke Rd Unit G2610
- 1116 S New Wilke Rd Unit G269
- 1116 S New Wilke Rd Unit G264