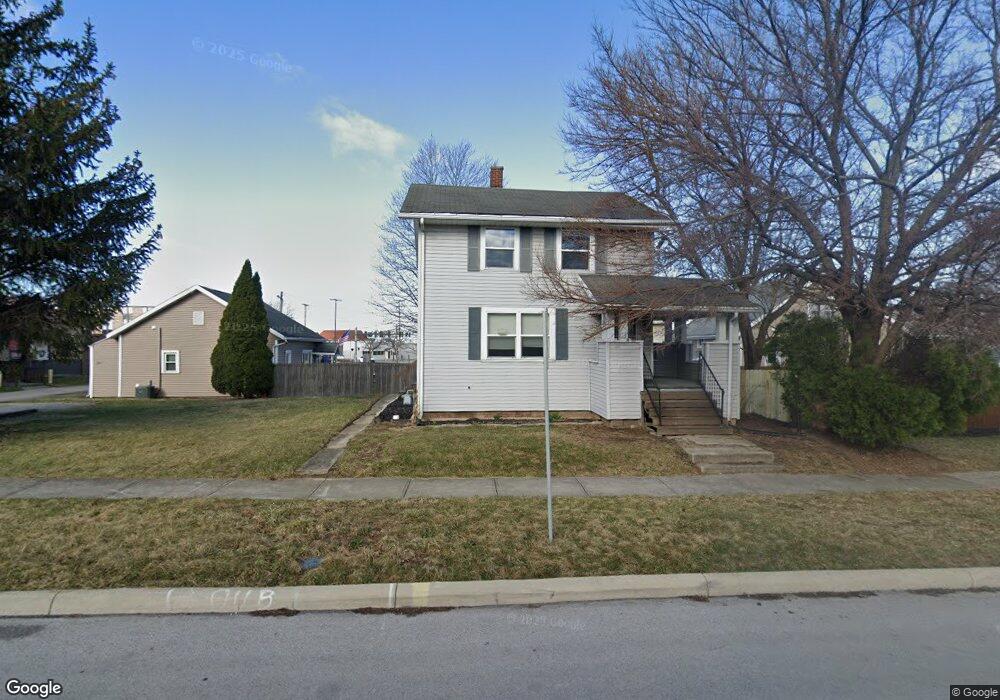
1116 Summit St Findlay, OH 45840
Estimated Value: $127,937 - $149,000
2
Beds
1
Bath
1,300
Sq Ft
$104/Sq Ft
Est. Value
About This Home
Open House Sunday, March 23, 2025 from 2-4 pm. Large 2 bedroom, 2 bath home on Findlay's west side for rent. Close to downtown with nice deck. Range and refrigerator provided, washer/dryer hookup available. Note: home does not have central air. All utilities are tenant's responsibility. Prefer no pets but will consider 1 pet under 25 pounds with property owner's approval and pet deposit. References, background check and credit check are required. 1 year lease, then month-to-month. Rent is $1050/mo., security deposit is $1050.
Ownership History
Date
Name
Owned For
Owner Type
Purchase Details
Closed on
Aug 6, 2020
Sold by
Ogg Ryan M
Bought by
Accord Property Management Llc
Current Estimated Value
Purchase Details
Closed on
Feb 23, 2009
Sold by
Secretary Of Housing & Urban Development
Bought by
Ogg Ryan M
Purchase Details
Closed on
Aug 30, 2006
Sold by
Prater Melissa Ann
Bought by
Hud
Purchase Details
Closed on
Sep 2, 1998
Sold by
Sexton Robert
Bought by
Prater Melissa
Purchase Details
Closed on
Nov 1, 1988
Bought by
Sexton Robert E and Sexton Lena M
Purchase Details
Closed on
Aug 3, 1983
Bought by
Wagner Walter and Wagner Frances
Create a Home Valuation Report for This Property
The Home Valuation Report is an in-depth analysis detailing your home's value as well as a comparison with similar homes in the area
Home Values in the Area
Average Home Value in this Area
Purchase History
| Date | Buyer | Sale Price | Title Company |
|---|---|---|---|
| Accord Property Management Llc | -- | None Available | |
| Ogg Ryan M | $4,000 | Lakeside Title & Escrow Agen | |
| Hud | $38,000 | None Available | |
| Prater Melissa | $49,900 | -- | |
| Sexton Robert E | $22,100 | -- | |
| Wagner Walter | $21,500 | -- |
Source: Public Records
Property History
| Date | Event | Price | List to Sale | Price per Sq Ft |
|---|---|---|---|---|
| 04/01/2025 04/01/25 | Off Market | $1,050 | -- | -- |
| 03/18/2025 03/18/25 | For Rent | $1,050 | -- | -- |
Tax History
| Year | Tax Paid | Tax Assessment Tax Assessment Total Assessment is a certain percentage of the fair market value that is determined by local assessors to be the total taxable value of land and additions on the property. | Land | Improvement |
|---|---|---|---|---|
| 2024 | $1,130 | $31,000 | $5,500 | $25,500 |
| 2023 | $1,132 | $31,000 | $5,500 | $25,500 |
| 2022 | $1,128 | $31,000 | $5,500 | $25,500 |
| 2021 | $1,164 | $27,870 | $5,640 | $22,230 |
| 2020 | $1,164 | $27,870 | $5,640 | $22,230 |
| 2019 | $1,141 | $27,870 | $5,640 | $22,230 |
| 2018 | $1,055 | $23,640 | $3,970 | $19,670 |
| 2017 | $528 | $23,640 | $3,970 | $19,670 |
| 2016 | $1,051 | $23,640 | $3,970 | $19,670 |
| 2015 | $670 | $14,900 | $3,400 | $11,500 |
| 2014 | $670 | $14,900 | $3,400 | $11,500 |
| 2012 | $676 | $14,900 | $3,400 | $11,500 |
Source: Public Records
Map
Nearby Homes
- 1113 Hurd Ave
- 416 1/2 Lima Ave
- 412 Lima Ave
- 845 Hurd Ave
- 324 W Mcpherson Ave
- 1304 Douglas Pkwy
- 865 S Main St
- 123 Glendale Ave
- 514 Liberty St
- 829 Maple Ave
- 1604 Gray St
- 315 Fairlawn Place
- 331 Fairlawn Place
- 807 W Main Cross St
- 407 Washington St
- 731 5th St
- 0 Waterford Way Lot 78 Unit 6089639
- 1604 Payne Ave
- 0 Bushwillow Dr Unit Lot 154
- 0 Bushwillow Dr Lot 156 Unit 6079046
Your Personal Tour Guide
Ask me questions while you tour the home.