Estimated Value: $335,000 - $378,000
4
Beds
2
Baths
2,368
Sq Ft
$150/Sq Ft
Est. Value
About This Home
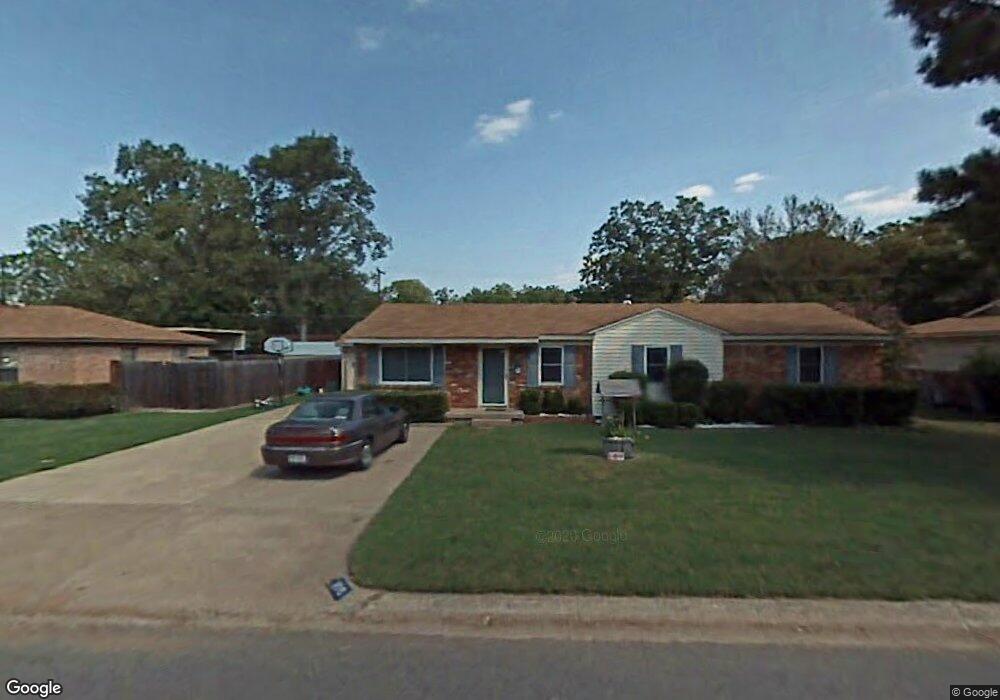
This home is located at 1116 Valentine St, Hurst, TX 76053 and is currently estimated at $354,625, approximately $149 per square foot. 1116 Valentine St is a home located in Tarrant County with nearby schools including Harrison Lane Elementary School, Hurst J High School, and L.D. Bell High School.
Ownership History
Date
Name
Owned For
Owner Type
Purchase Details
Closed on
Apr 18, 2025
Sold by
South Central Investment Group Llc
Bought by
Enlow Anthony and Enlow Margaret
Current Estimated Value
Purchase Details
Closed on
Jan 30, 2019
Sold by
Patterson Richard and Patterson Susan C
Bought by
Patterson Richard G
Purchase Details
Closed on
Aug 27, 2009
Sold by
Baxter Patricia
Bought by
Patterson Richard G and Patterson Richard W
Home Financials for this Owner
Home Financials are based on the most recent Mortgage that was taken out on this home.
Original Mortgage
$98,188
Interest Rate
5.2%
Mortgage Type
FHA
Purchase Details
Closed on
May 31, 1996
Sold by
Baxter Charles R and Baxter Marlyn G
Bought by
Baxter Donald R and Baxter Patricia
Home Financials for this Owner
Home Financials are based on the most recent Mortgage that was taken out on this home.
Original Mortgage
$76,200
Interest Rate
7.93%
Mortgage Type
FHA
Create a Home Valuation Report for This Property
The Home Valuation Report is an in-depth analysis detailing your home's value as well as a comparison with similar homes in the area
Home Values in the Area
Average Home Value in this Area
Purchase History
| Date | Buyer | Sale Price | Title Company |
|---|---|---|---|
| Enlow Anthony | -- | Spark Title | |
| Patterson Richard G | -- | None Available | |
| Patterson Richard G | -- | Alamo Title | |
| Baxter Donald R | -- | Commonwealth Land Title |
Source: Public Records
Mortgage History
| Date | Status | Borrower | Loan Amount |
|---|---|---|---|
| Previous Owner | Patterson Richard G | $98,188 | |
| Previous Owner | Baxter Donald R | $76,200 |
Source: Public Records
Tax History Compared to Growth
Tax History
| Year | Tax Paid | Tax Assessment Tax Assessment Total Assessment is a certain percentage of the fair market value that is determined by local assessors to be the total taxable value of land and additions on the property. | Land | Improvement |
|---|---|---|---|---|
| 2025 | $4,260 | $347,083 | $55,000 | $292,083 |
| 2024 | $4,260 | $347,083 | $55,000 | $292,083 |
| 2023 | $5,201 | $339,861 | $40,000 | $299,861 |
| 2022 | $5,434 | $270,140 | $40,000 | $230,140 |
| 2021 | $5,174 | $231,169 | $40,000 | $191,169 |
| 2020 | $4,692 | $216,208 | $40,000 | $176,208 |
| 2019 | $4,339 | $195,558 | $40,000 | $155,558 |
| 2018 | $3,631 | $161,184 | $19,000 | $142,184 |
| 2017 | $3,708 | $155,079 | $19,000 | $136,079 |
| 2016 | $3,371 | $140,072 | $19,000 | $121,072 |
| 2015 | $3,035 | $121,100 | $15,000 | $106,100 |
| 2014 | $3,035 | $121,100 | $15,000 | $106,100 |
Source: Public Records
Map
Nearby Homes
- 1136 Simpson Dr
- 420 Bedford Ct W
- 409 Vicki Place
- 1016 Keith Dr
- 400 Joanna Dr
- 1220 Norwood Dr
- 1208 Karla Dr
- 905 Brown Trail
- 1337 Harrison Ln
- 127 W Cedar St
- 1208 Birch St
- 116 Oakhurst Dr
- 1352 Simpson Dr
- 1348 Norwood Dr
- 802 Brown Trail
- 1145 Terrace Trail
- 803 Glenda Dr
- 624 Harrison Ln
- 341 Hurst Dr
- 632 Forest Ln
- 1112 Valentine St
- 1120 Valentine St
- 1117 Reed St
- 1113 Reed St
- 1121 Reed St
- 1117 Valentine St
- 1121 Valentine St
- 1108 Valentine St
- 1113 Valentine St
- 1109 Reed St
- 1125 Valentine St
- 1128 Valentine St
- 1116 Reed St
- 1129 Reed St
- 1120 Reed St
- 1120 Cavender Dr
- 1116 Cavender Dr
- 1109 Valentine St
- 1129 Valentine St
- 1112 Reed St