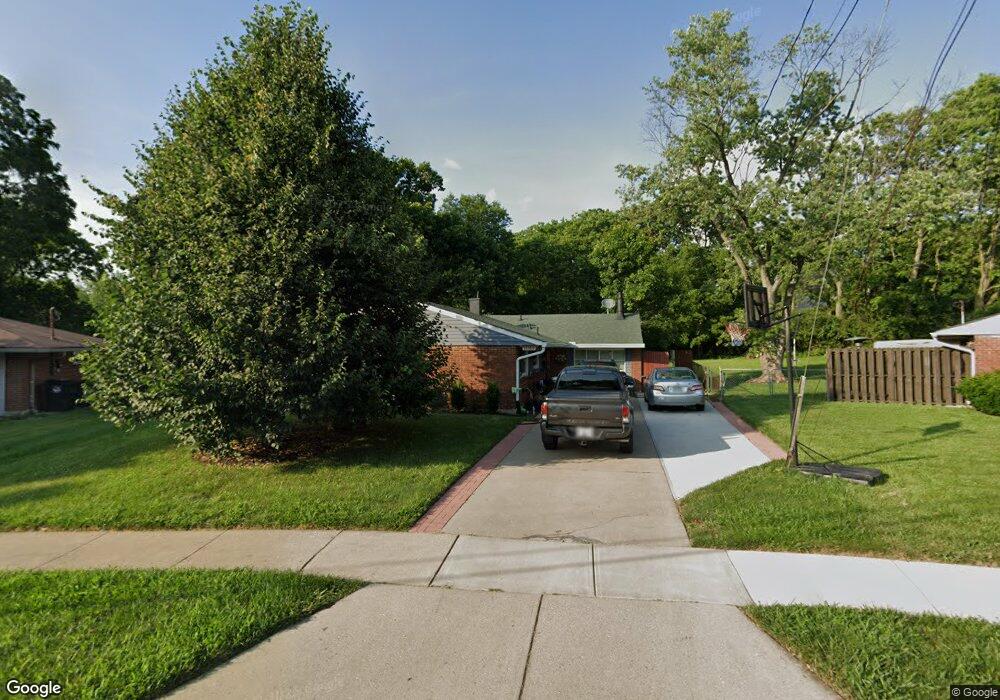
11160 Mulligan St Cincinnati, OH 45241
Estimated Value: $255,000 - $318,000
4
Beds
2
Baths
1,755
Sq Ft
$165/Sq Ft
Est. Value
About This Home
This home is located at 11160 Mulligan St, Cincinnati, OH 45241 and is currently estimated at $288,768, approximately $164 per square foot. 11160 Mulligan St is a home located in Hamilton County with nearby schools including Sharonville Elementary School, Princeton Community Middle School, and Princeton High School.
Ownership History
Date
Name
Owned For
Owner Type
Purchase Details
Closed on
Sep 26, 2001
Sold by
Fischer Maxine
Bought by
Franklin Brian J and Franklin Rachel M
Current Estimated Value
Home Financials for this Owner
Home Financials are based on the most recent Mortgage that was taken out on this home.
Original Mortgage
$116,669
Outstanding Balance
$46,002
Interest Rate
6.99%
Mortgage Type
FHA
Estimated Equity
$242,766
Purchase Details
Closed on
Aug 8, 2001
Sold by
Hing Choi and Hing Sen
Bought by
Fischer Maxine
Home Financials for this Owner
Home Financials are based on the most recent Mortgage that was taken out on this home.
Original Mortgage
$116,669
Outstanding Balance
$46,002
Interest Rate
6.99%
Mortgage Type
FHA
Estimated Equity
$242,766
Purchase Details
Closed on
Feb 10, 1997
Sold by
Nguyen Phan and Nguyen Y
Bought by
Huynh Sen
Create a Home Valuation Report for This Property
The Home Valuation Report is an in-depth analysis detailing your home's value as well as a comparison with similar homes in the area
Home Values in the Area
Average Home Value in this Area
Purchase History
| Date | Buyer | Sale Price | Title Company |
|---|---|---|---|
| Franklin Brian J | $118,500 | -- | |
| Fischer Maxine | $108,000 | -- | |
| Huynh Sen | $85,000 | -- |
Source: Public Records
Mortgage History
| Date | Status | Borrower | Loan Amount |
|---|---|---|---|
| Open | Franklin Brian J | $116,669 |
Source: Public Records
Tax History Compared to Growth
Tax History
| Year | Tax Paid | Tax Assessment Tax Assessment Total Assessment is a certain percentage of the fair market value that is determined by local assessors to be the total taxable value of land and additions on the property. | Land | Improvement |
|---|---|---|---|---|
| 2024 | $3,115 | $72,380 | $18,235 | $54,145 |
| 2023 | $3,056 | $72,380 | $18,235 | $54,145 |
| 2022 | $2,683 | $51,174 | $12,075 | $39,099 |
| 2021 | $2,664 | $51,174 | $12,075 | $39,099 |
| 2020 | $2,626 | $51,174 | $12,075 | $39,099 |
| 2019 | $2,494 | $44,499 | $10,500 | $33,999 |
| 2018 | $2,345 | $44,499 | $10,500 | $33,999 |
| 2017 | $2,232 | $44,499 | $10,500 | $33,999 |
| 2016 | $2,155 | $42,081 | $9,975 | $32,106 |
| 2015 | $2,143 | $42,081 | $9,975 | $32,106 |
| 2014 | $2,146 | $42,081 | $9,975 | $32,106 |
| 2013 | $2,205 | $44,296 | $10,500 | $33,796 |
Source: Public Records
Map
Nearby Homes
- 4170 Cornell Rd
- 11220 Foremark Dr
- 4420 Cornell Rd
- 10914 Lemarie Dr
- 11192 Jardin Place
- 10823 Willfleet Dr
- 3706 Verbena Dr
- 10775 Lemarie Dr
- 10912 Aztec Ct
- 10788 Thornview Dr
- 4071 E Kemper Rd
- 4086 Retreat Dr
- Lexington Plan at Chimney Ridge
- Vaquero Plan at Chimney Ridge
- 4051 Beavercreek Cir
- 3380 Spurrier Ln
- 3325 Mcgrew St
- 3592 Horncastle Dr
- 5026 Lord Alfred Ct
- 3756 Glendale Milford Rd
- 11156 Mulligan St
- 11164 Mulligan St
- 4077 Peachey Ct
- 11152 Mulligan St
- 11166 Mulligan St
- 4083 Peachey Ct
- 11157 Mulligan St
- 11117 Allenhurst Blvd W
- 4091 Cornell Rd
- 4071 Cornell Rd
- 11144 Mulligan St
- 11165 Mulligan St
- 11123 Allenhurst Blvd W
- 11168 Hawk St
- 11111 Allenhurst Blvd W
- 11176 Hawk St
- 4084 Peachey Ct
- 11141 Mulligan St
- 11138 Mulligan St
- 11154 Hawk St