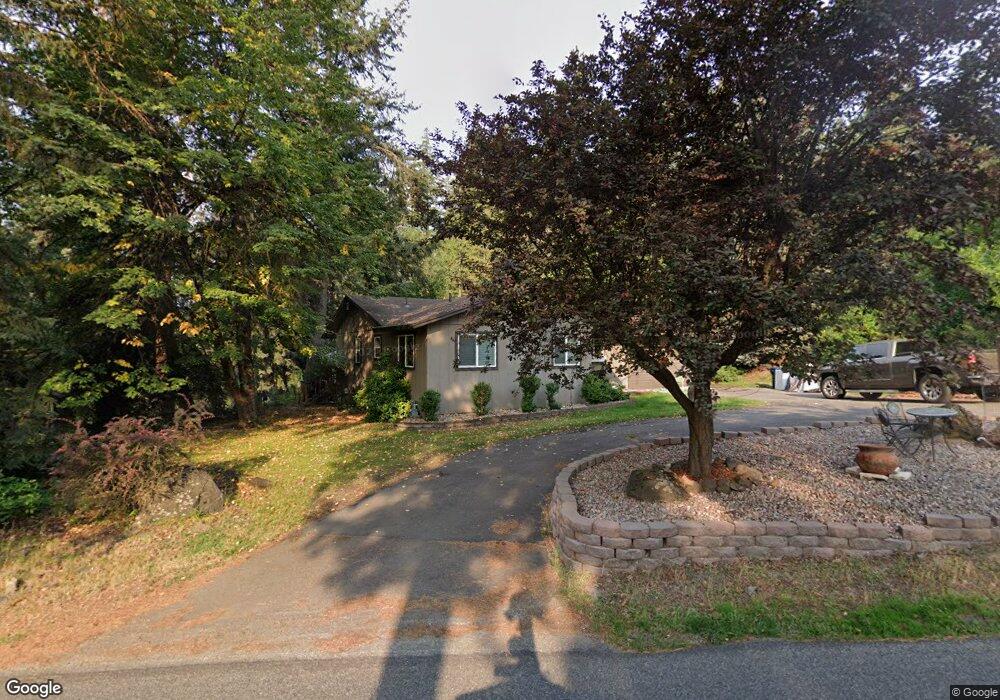
11169 N Avondale Loop Hayden, ID 83835
Avondale on Hayden NeighborhoodEstimated Value: $600,000 - $714,000
2
Beds
2
Baths
1,260
Sq Ft
$513/Sq Ft
Est. Value
About This Home
This home is located at 11169 N Avondale Loop, Hayden, ID 83835 and is currently estimated at $645,766, approximately $512 per square foot. 11169 N Avondale Loop is a home located in Kootenai County with nearby schools including Hayden Meadows Elementary School, Canfield Middle School, and Coeur d'Alene High School.
Ownership History
Date
Name
Owned For
Owner Type
Purchase Details
Closed on
Jul 7, 2020
Sold by
Longdin Jon and Longdin Shannon
Bought by
Crain David
Current Estimated Value
Home Financials for this Owner
Home Financials are based on the most recent Mortgage that was taken out on this home.
Original Mortgage
$312,000
Outstanding Balance
$276,043
Interest Rate
3.1%
Mortgage Type
New Conventional
Estimated Equity
$369,723
Purchase Details
Closed on
May 7, 2018
Sold by
Garrison Gary D and Garrison Kisi
Bought by
Longdin Jon and Longdin Shannon
Purchase Details
Closed on
Sep 29, 2008
Sold by
Ryan David M and Ryan Ricky L
Bought by
Garrison Gary D and Garrison Kisi
Home Financials for this Owner
Home Financials are based on the most recent Mortgage that was taken out on this home.
Original Mortgage
$261,548
Interest Rate
6.43%
Mortgage Type
FHA
Create a Home Valuation Report for This Property
The Home Valuation Report is an in-depth analysis detailing your home's value as well as a comparison with similar homes in the area
Home Values in the Area
Average Home Value in this Area
Purchase History
| Date | Buyer | Sale Price | Title Company |
|---|---|---|---|
| Crain David | -- | First American Ttl Kootenai | |
| Longdin Jon | -- | Pioneer Title Co | |
| Garrison Gary D | -- | Pioneer Title Co |
Source: Public Records
Mortgage History
| Date | Status | Borrower | Loan Amount |
|---|---|---|---|
| Open | Crain David | $312,000 | |
| Previous Owner | Garrison Gary D | $261,548 |
Source: Public Records
Tax History Compared to Growth
Tax History
| Year | Tax Paid | Tax Assessment Tax Assessment Total Assessment is a certain percentage of the fair market value that is determined by local assessors to be the total taxable value of land and additions on the property. | Land | Improvement |
|---|---|---|---|---|
| 2025 | $2,428 | $586,823 | $270,000 | $316,823 |
| 2024 | $2,336 | $577,523 | $260,000 | $317,523 |
| 2023 | $2,336 | $604,560 | $275,000 | $329,560 |
| 2022 | $2,630 | $668,940 | $280,000 | $388,940 |
| 2021 | $2,552 | $396,096 | $165,000 | $231,096 |
| 2020 | $1,651 | $325,190 | $130,000 | $195,190 |
| 2019 | $2,455 | $313,490 | $130,000 | $183,490 |
| 2018 | $2,445 | $279,640 | $138,000 | $141,640 |
| 2017 | $1,528 | $258,980 | $120,000 | $138,980 |
| 2016 | $1,442 | $238,150 | $105,800 | $132,350 |
| 2015 | $1,395 | $224,750 | $92,000 | $132,750 |
| 2013 | $1,061 | $163,010 | $51,750 | $111,260 |
Source: Public Records
Map
Nearby Homes
- 1997 E Avondale Ln
- 11494 N Avondale Loop
- 1467 E Lacey Ave
- 1538 E Bruin Loop
- 1547 E Stratford Dr
- 1560 E Bruin Loop
- 10569 N Friar Dr Unit B
- 162483 N Lakeview Dr
- 10430 N Strahorn Rd
- 1389 E Ezra Ave
- 11042 N Cattle Dr
- 10351 N Gibson Rd
- 10589 N Crimson Dr
- 1243 E Sleeping Deer Ave
- 1080 E Sleeping Deer Ave
- 2992 E Lake Forest Dr
- 952 E Steeple Chase Rd
- 1002 E Sleeping Deer Ave
- 3089 Lake Forest Dr
- 10934 N Maple St
- 11140 N Avondale Loop
- 11101 N Avondale Loop
- 11170 N Avondale Loop
- 11201 N Avondale Loop
- 11176 N Avondale Loop
- 1965 E Avondale Ln
- 11215 N Avondale Loop
- 11217 N Avondale Loop
- NNA E Avondale Ln
- 11235 N Avondale Loop
- 0 Avondale Ln L17b1
- 0 Avondale
- 1968 E Avondale Ln
- 11206 N Avondale Loop
- 11247 N Avondale Loop
- 1992 E Avondale Ln
- 11222 N Avondale Loop
- 2021 E Avondale Ln
- 11273 N Avondale Loop
- 2375 E Avondale Ln