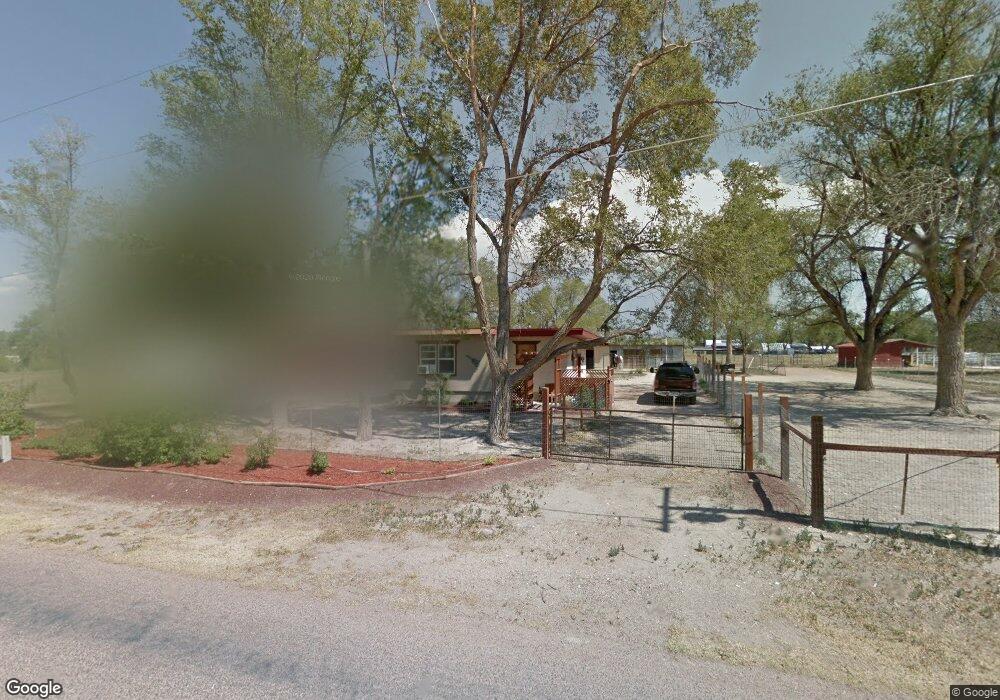
1117 9th St Penrose, CO 81240
Estimated Value: $210,876 - $303,000
2
Beds
1
Bath
1,484
Sq Ft
$171/Sq Ft
Est. Value
About This Home
This home is located at 1117 9th St, Penrose, CO 81240 and is currently estimated at $253,219, approximately $170 per square foot. 1117 9th St is a home located in Fremont County with nearby schools including Penrose Elementary School and Florence High School.
Ownership History
Date
Name
Owned For
Owner Type
Purchase Details
Closed on
Oct 17, 2008
Sold by
Tyler Lance H and Tyler Gail L
Bought by
Whipker Richard T and Whipker Janet S
Current Estimated Value
Home Financials for this Owner
Home Financials are based on the most recent Mortgage that was taken out on this home.
Original Mortgage
$59,160
Outstanding Balance
$38,377
Interest Rate
6.35%
Mortgage Type
New Conventional
Estimated Equity
$214,843
Purchase Details
Closed on
May 27, 2008
Sold by
Federal Home Loan Mortgage Corporation
Bought by
Tyler Lance H and Tyler Gail L
Purchase Details
Closed on
Apr 14, 2008
Sold by
Nicholas Drew M and Nicholas Gail L
Bought by
Federal Home Loan Mortgage Corporation
Create a Home Valuation Report for This Property
The Home Valuation Report is an in-depth analysis detailing your home's value as well as a comparison with similar homes in the area
Home Values in the Area
Average Home Value in this Area
Purchase History
| Date | Buyer | Sale Price | Title Company |
|---|---|---|---|
| Whipker Richard T | $58,000 | Security Title | |
| Tyler Lance H | $44,250 | Chicago Title | |
| Tyler Lance H | $44,250 | Chicago Title Co | |
| Federal Home Loan Mortgage Corporation | -- | None Available |
Source: Public Records
Mortgage History
| Date | Status | Borrower | Loan Amount |
|---|---|---|---|
| Open | Whipker Richard T | $59,160 |
Source: Public Records
Tax History
| Year | Tax Paid | Tax Assessment Tax Assessment Total Assessment is a certain percentage of the fair market value that is determined by local assessors to be the total taxable value of land and additions on the property. | Land | Improvement |
|---|---|---|---|---|
| 2025 | $938 | $12,606 | -- | -- |
| 2024 | $938 | $12,484 | $0 | $0 |
| 2023 | $623 | $8,464 | $0 | $0 |
| 2022 | $754 | $10,339 | $0 | $0 |
| 2021 | $763 | $10,636 | $0 | $0 |
| 2020 | $547 | $8,896 | $0 | $0 |
| 2019 | $549 | $8,896 | $0 | $0 |
| 2018 | $474 | $7,698 | $0 | $0 |
| 2017 | $483 | $7,698 | $0 | $0 |
| 2016 | $498 | $8,070 | $0 | $0 |
| 2015 | $492 | $8,070 | $0 | $0 |
| 2012 | $512 | $7,747 | $3,184 | $4,563 |
Source: Public Records
Map
Nearby Homes
Your Personal Tour Guide
Ask me questions while you tour the home.