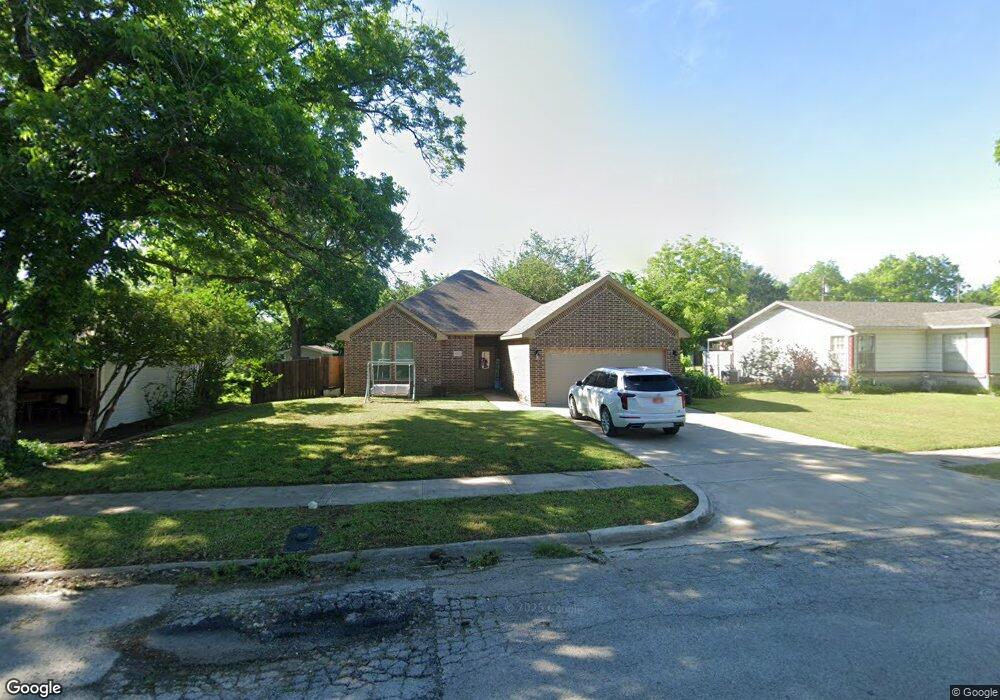
1117 Bales St Cleburne, TX 76033
Estimated Value: $235,914 - $255,000
3
Beds
2
Baths
1,271
Sq Ft
$193/Sq Ft
Est. Value
About This Home
This home is located at 1117 Bales St, Cleburne, TX 76033 and is currently estimated at $244,729, approximately $192 per square foot. 1117 Bales St is a home located in Johnson County with nearby schools including Cooke Elementary School, A.D. Wheat Middle School, and Cleburne High School.
Ownership History
Date
Name
Owned For
Owner Type
Purchase Details
Closed on
Oct 20, 2017
Sold by
Eduy J James
Bought by
Mangrum Kaleigh
Current Estimated Value
Home Financials for this Owner
Home Financials are based on the most recent Mortgage that was taken out on this home.
Original Mortgage
$137,750
Outstanding Balance
$115,245
Interest Rate
3.88%
Estimated Equity
$129,484
Purchase Details
Closed on
Aug 11, 2014
Sold by
Rolon Francisco A and Rolon Evelyn
Bought by
James Argenis A and James Eduy J
Purchase Details
Closed on
Oct 25, 2013
Sold by
The Secretary Of Hud
Bought by
Beltran Pio
Purchase Details
Closed on
Oct 20, 2011
Sold by
Bank Of America Na
Bought by
Rolon Francisco A and Rolon Evelyn
Purchase Details
Closed on
May 3, 2011
Sold by
Haberthur Reba Jean
Bought by
Financial Freedom Acquisition Llc
Create a Home Valuation Report for This Property
The Home Valuation Report is an in-depth analysis detailing your home's value as well as a comparison with similar homes in the area
Home Values in the Area
Average Home Value in this Area
Purchase History
| Date | Buyer | Sale Price | Title Company |
|---|---|---|---|
| Mangrum Kaleigh | -- | -- | |
| James Argenis A | -- | Providence Title Co | |
| Beltran Pio | -- | None Available | |
| Rolon Francisco A | -- | Lawyers Title | |
| Financial Freedom Acquisition Llc | $11,000 | None Available |
Source: Public Records
Mortgage History
| Date | Status | Borrower | Loan Amount |
|---|---|---|---|
| Open | Mangrum Kaleigh | $137,750 | |
| Closed | Mangrum Kaleigh | -- | |
| Closed | James Argenis A | $0 |
Source: Public Records
Tax History Compared to Growth
Tax History
| Year | Tax Paid | Tax Assessment Tax Assessment Total Assessment is a certain percentage of the fair market value that is determined by local assessors to be the total taxable value of land and additions on the property. | Land | Improvement |
|---|---|---|---|---|
| 2025 | $3,932 | $239,228 | $40,000 | $199,228 |
| 2024 | $5,334 | $239,228 | $40,000 | $199,228 |
| 2023 | $3,515 | $219,484 | $40,000 | $179,484 |
| 2022 | $5,075 | $202,768 | $35,250 | $167,518 |
| 2021 | $4,628 | $177,366 | $30,500 | $146,866 |
| 2020 | $4,679 | $168,866 | $22,000 | $146,866 |
| 2019 | $4,990 | $168,866 | $22,000 | $146,866 |
| 2018 | $4,292 | $145,179 | $19,294 | $125,885 |
| 2017 | $567 | $19,250 | $19,250 | $0 |
| 2016 | $412 | $14,000 | $14,000 | $0 |
| 2015 | $373 | $14,000 | $14,000 | $0 |
| 2014 | $373 | $14,000 | $14,000 | $0 |
Source: Public Records
Map
Nearby Homes
- 1123 Bales St
- 1307 Joslin St
- 902 Turner St
- 1315 Grand Ave
- 805 Marengo St
- 916 Poindexter Ave
- 808 Marengo St
- 905 Euclid St
- 618 Woodard Ave
- 800 Madison St
- 1300 Holly St
- 807 Poindexter Ave
- 810 Euclid St
- 107 Woodard Ave
- 1006 Princeton Place
- 1419 Quail Creek Dr
- Iverson 1 Plan at Trail Creek
- Hanover Plan at Trail Creek
- Devin Plan at Trail Creek
- Newcastle Plan at Trail Creek
- 1119 Bales St
- 1115 Bales St
- 1121 Bales St
- 1113 Bales St
- 1114 Poindexter Ave
- 1112 Poindexter Ave
- 1116 Poindexter Ave
- 1111 Bales St
- 1110 Poindexter Ave
- 1114 Bales St
- 1118 Poindexter Ave
- 1202 Bales St
- 1112 Bales St
- 1108 Poindexter Ave
- 1120 Poindexter Ave
- 1109 Bales St
- 1204 Bales St
- 1110 Bales St
- 1106 Poindexter Ave
- 1107 Bales St