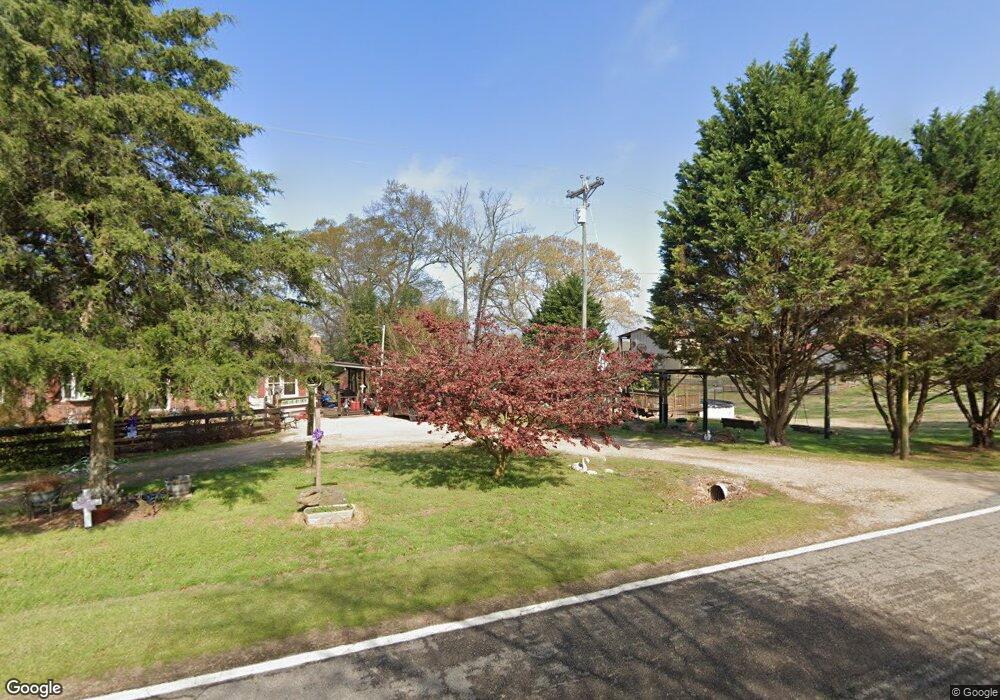
1117 Cromers Bridge Rd Royston, GA 30662
Estimated Value: $117,000 - $240,000
3
Beds
2
Baths
1,835
Sq Ft
$103/Sq Ft
Est. Value
About This Home
This home is located at 1117 Cromers Bridge Rd, Royston, GA 30662 and is currently estimated at $189,402, approximately $103 per square foot. 1117 Cromers Bridge Rd is a home located in Franklin County with nearby schools including Franklin County High School.
Ownership History
Date
Name
Owned For
Owner Type
Purchase Details
Closed on
Oct 25, 2023
Sold by
Langston Kenneth Wayne
Bought by
Jones Chanice L and Langston Kenneth Joseph
Current Estimated Value
Purchase Details
Closed on
Jan 10, 2008
Sold by
Langston Kenneth Wayne
Bought by
Langston Kenneth Joseph
Create a Home Valuation Report for This Property
The Home Valuation Report is an in-depth analysis detailing your home's value as well as a comparison with similar homes in the area
Home Values in the Area
Average Home Value in this Area
Purchase History
| Date | Buyer | Sale Price | Title Company |
|---|---|---|---|
| Jones Chanice L | -- | -- | |
| Langston Kenneth Joseph | -- | -- | |
| Ballew Jennifer Kay | -- | -- | |
| Langston Kenneth Joseph | -- | -- |
Source: Public Records
Tax History Compared to Growth
Tax History
| Year | Tax Paid | Tax Assessment Tax Assessment Total Assessment is a certain percentage of the fair market value that is determined by local assessors to be the total taxable value of land and additions on the property. | Land | Improvement |
|---|---|---|---|---|
| 2024 | $1,343 | $56,425 | $4,101 | $52,324 |
| 2023 | $1,957 | $77,854 | $29,927 | $47,927 |
| 2022 | $1,262 | $68,722 | $25,986 | $42,736 |
| 2021 | $1,174 | $62,633 | $25,986 | $36,647 |
| 2020 | $1,160 | $54,479 | $17,832 | $36,647 |
| 2019 | $1,117 | $54,479 | $17,832 | $36,647 |
| 2018 | $999 | $58,037 | $26,479 | $31,558 |
| 2017 | $1,035 | $58,037 | $26,479 | $31,558 |
| 2016 | $950 | $53,691 | $26,479 | $27,212 |
| 2015 | -- | $53,690 | $0 | $0 |
| 2014 | -- | $48,501 | $0 | $0 |
| 2013 | -- | $0 | $0 | $0 |
Source: Public Records
Map
Nearby Homes
- 0 Nails Creek Crossing Unit 10584678
- 4308 Athens Rd
- 41 Manley Terrace
- 9 Dons Ct
- 31 Dons Ct
- 1000 Nails Creek Crossing
- 1291 Brays Lake Rd
- 689 Riverside Ct
- 318 Jim Grizzle Rd
- 352 Jim Grizzle Rd
- 2695 Brays Lake Rd
- 166 Timberlane Dr
- 222 Reno Rd
- 1344 Jim Grizzle Rd
- 1112 Reno Rd
- 8188 Sandy Cross Rd
- 1079 Hardeman Farm Rd
- 5591 Jot Em Down Rd
- 157 Riverbend Cir
- 597 Meadow Brook Ln
- 1219 Cromers Bridge Rd
- 1025 Cromers Bridge Rd
- 975 Cromers Bridge Rd
- 79 Cromers Bridge Ln
- 1414 Cromers Bridge Rd
- 1478 Cromers Bridge Rd
- 38 Cromers Bridge Ln
- 1484 Cromers Bridge Rd
- 869 Cromers Bridge Rd
- 1386 Cromers Bridge Rd
- 1459 Cromers Bridge Rd
- 1480 Cromer's Bridge Rd
- 3520 Athens Rd
- 1480 Cromers Bridge Rd
- 740 Cromers Bridge Rd
- 3400 Athens Rd
- 3368 Athens Rd
- 793 Cromers Bridge Rd
- 723 Cromers Bridge Rd
- 1545 Cromers Bridge Rd