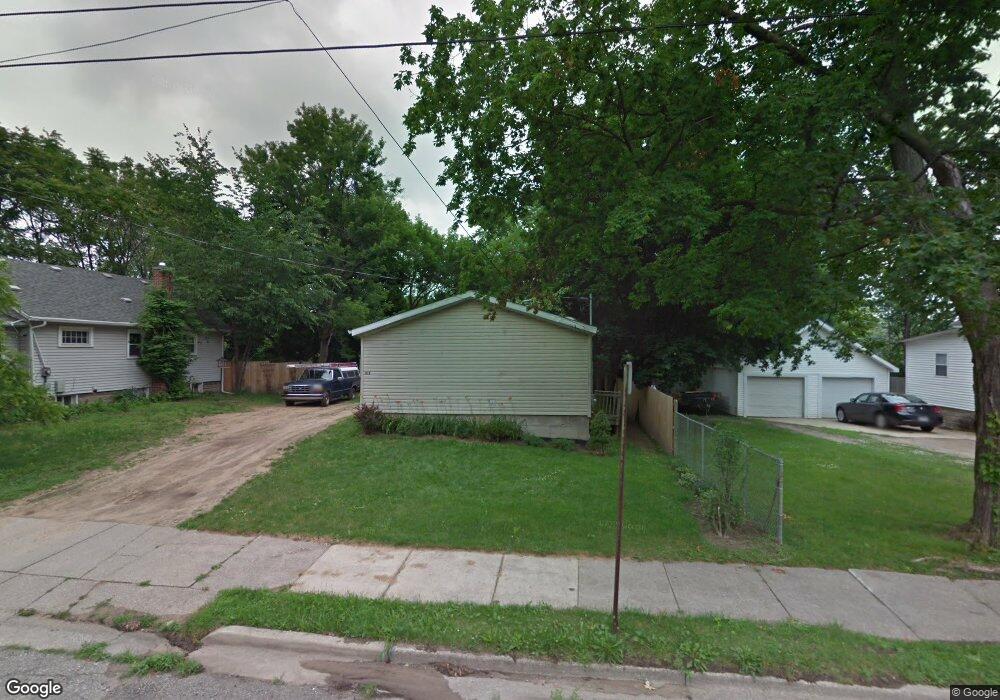
1117 Lathrop St Lansing, MI 48912
Potter Walsh NeighborhoodEstimated Value: $77,000 - $104,000
3
Beds
2
Baths
900
Sq Ft
$98/Sq Ft
Est. Value
About This Home
This home is located at 1117 Lathrop St, Lansing, MI 48912 and is currently estimated at $88,346, approximately $98 per square foot. 1117 Lathrop St is a home located in Ingham County with nearby schools including Pattengill Academy, Lyons Elementary School, and Eastern High School.
Ownership History
Date
Name
Owned For
Owner Type
Purchase Details
Closed on
Feb 24, 2010
Sold by
Donovan Shaun
Bought by
Andrews Donald
Current Estimated Value
Purchase Details
Closed on
Aug 24, 2009
Sold by
Fifth Third Mortgage Mi Llc
Bought by
Secretary Of Housing & Urban Development
Purchase Details
Closed on
Aug 28, 2008
Sold by
Reiffer Simon M
Bought by
Fifth Third Mortgage Mi Llc
Purchase Details
Closed on
Dec 19, 2006
Sold by
Wright Kerry
Bought by
Reiffer Simon M
Home Financials for this Owner
Home Financials are based on the most recent Mortgage that was taken out on this home.
Original Mortgage
$73,420
Interest Rate
6.28%
Mortgage Type
FHA
Purchase Details
Closed on
Feb 26, 2004
Sold by
Sawyer William
Bought by
Wright Kerry
Purchase Details
Closed on
Feb 2, 2001
Sold by
Law Robert A and Law Diana L
Bought by
Sawyer William
Create a Home Valuation Report for This Property
The Home Valuation Report is an in-depth analysis detailing your home's value as well as a comparison with similar homes in the area
Home Values in the Area
Average Home Value in this Area
Purchase History
| Date | Buyer | Sale Price | Title Company |
|---|---|---|---|
| Andrews Donald | $19,500 | None Available | |
| Secretary Of Housing & Urban Development | -- | None Available | |
| Fifth Third Mortgage Mi Llc | $77,360 | None Available | |
| Reiffer Simon M | $74,000 | Fatic | |
| Wright Kerry | $30,000 | Bell Title Company | |
| Sawyer William | $10,000 | -- |
Source: Public Records
Mortgage History
| Date | Status | Borrower | Loan Amount |
|---|---|---|---|
| Previous Owner | Reiffer Simon M | $73,420 |
Source: Public Records
Tax History Compared to Growth
Tax History
| Year | Tax Paid | Tax Assessment Tax Assessment Total Assessment is a certain percentage of the fair market value that is determined by local assessors to be the total taxable value of land and additions on the property. | Land | Improvement |
|---|---|---|---|---|
| 2025 | $1,554 | $30,000 | $4,100 | $25,900 |
| 2024 | $12 | $25,900 | $4,100 | $21,800 |
| 2023 | $1,459 | $22,900 | $4,100 | $18,800 |
| 2022 | $1,320 | $20,500 | $3,700 | $16,800 |
| 2021 | $1,301 | $20,300 | $4,000 | $16,300 |
| 2020 | $1,292 | $19,700 | $4,000 | $15,700 |
| 2019 | $1,251 | $19,500 | $4,000 | $15,500 |
| 2018 | $1,198 | $19,400 | $4,000 | $15,400 |
| 2017 | $1,146 | $19,400 | $4,000 | $15,400 |
| 2016 | $1,112 | $19,100 | $4,000 | $15,100 |
| 2015 | $1,112 | $18,900 | $8,011 | $10,889 |
| 2014 | $1,112 | $18,900 | $6,008 | $12,892 |
Source: Public Records
Map
Nearby Homes
- 1128 Lathrop St
- 1019 Dakin St
- 1204 Shepard St
- 1200 S Holmes St
- 1225 Regent St
- 910 S Holmes St
- 607 Shepard St Unit 2
- 1212 Climax St
- 523 Clifford St
- 1201 Climax St
- 637 S Clemens Ave
- 701 S Fairview Ave
- 727 S Magnolia Ave
- 517 S Clemens Ave
- 528 S Fairview Ave
- 515 S Clemens Ave
- 400 Lathrop St
- V/L E Kalamazoo St
- 624 S Hayford Ave
- 1128 Hickory St
- 1111 Lathrop St
- 1133 Lathrop St
- 1120 Lathrop St
- 1101 Lathrop St
- 1135 Lathrop St
- 1110 Lathrop St
- 1114 Lathrop St
- 1137 Lathrop St
- 1141 Lathrop St
- 1136 Lathrop St
- 1041 Lathrop St
- 1121 Mccullough St
- 1119 Mccullough St
- 1113 Mccullough St
- 1125 Mccullough St
- 1038 Lathrop St
- 1105 Mccullough St
- 1435 Perkins St