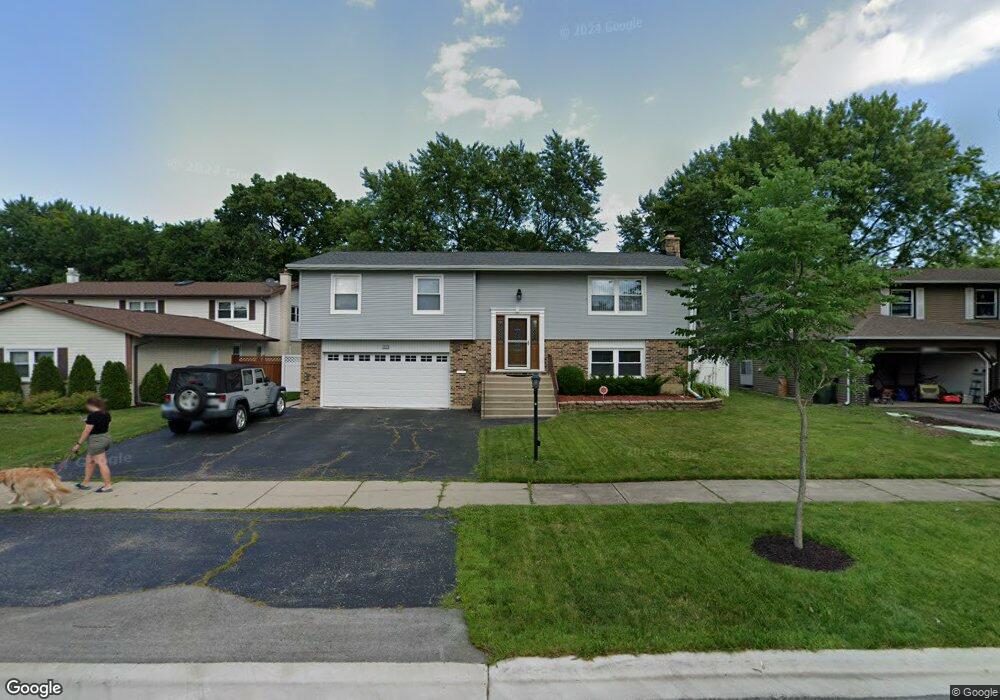
1117 N King Charles Ct Palatine, IL 60067
Pepper Tree NeighborhoodEstimated Value: $448,000 - $501,000
3
Beds
2
Baths
1,856
Sq Ft
$251/Sq Ft
Est. Value
About This Home
This home is located at 1117 N King Charles Ct, Palatine, IL 60067 and is currently estimated at $465,468, approximately $250 per square foot. 1117 N King Charles Ct is a home located in Cook County with nearby schools including Lincoln Elementary School, Walter R. Sundling Junior High School, and Palatine High School.
Ownership History
Date
Name
Owned For
Owner Type
Purchase Details
Closed on
Jan 29, 2016
Sold by
Rush William O and Kirwan Donna L
Bought by
Rush William O and Kirwan Donna L
Current Estimated Value
Purchase Details
Closed on
Feb 5, 2010
Sold by
Swanson Mary Ellen
Bought by
Rush William O
Home Financials for this Owner
Home Financials are based on the most recent Mortgage that was taken out on this home.
Original Mortgage
$291,513
Outstanding Balance
$192,836
Interest Rate
5.02%
Mortgage Type
FHA
Estimated Equity
$272,632
Purchase Details
Closed on
Jul 31, 2002
Sold by
Kilgore Glen D and Kilgore Joyce V
Bought by
Rush William O and Swanson Mary Ellen
Home Financials for this Owner
Home Financials are based on the most recent Mortgage that was taken out on this home.
Original Mortgage
$249,375
Interest Rate
5.87%
Mortgage Type
Purchase Money Mortgage
Create a Home Valuation Report for This Property
The Home Valuation Report is an in-depth analysis detailing your home's value as well as a comparison with similar homes in the area
Home Values in the Area
Average Home Value in this Area
Purchase History
| Date | Buyer | Sale Price | Title Company |
|---|---|---|---|
| Rush William O | -- | Attorney | |
| Rush William O | -- | Premier Title Company | |
| Rush William O | -- | -- |
Source: Public Records
Mortgage History
| Date | Status | Borrower | Loan Amount |
|---|---|---|---|
| Open | Rush William O | $291,513 | |
| Previous Owner | Rush William O | $249,375 |
Source: Public Records
Tax History Compared to Growth
Tax History
| Year | Tax Paid | Tax Assessment Tax Assessment Total Assessment is a certain percentage of the fair market value that is determined by local assessors to be the total taxable value of land and additions on the property. | Land | Improvement |
|---|---|---|---|---|
| 2024 | $8,595 | $35,000 | $8,008 | $26,992 |
| 2023 | $8,261 | $35,000 | $8,008 | $26,992 |
| 2022 | $8,261 | $35,000 | $8,008 | $26,992 |
| 2021 | $6,702 | $26,631 | $5,005 | $21,626 |
| 2020 | $6,733 | $26,631 | $5,005 | $21,626 |
| 2019 | $6,763 | $29,756 | $5,005 | $24,751 |
| 2018 | $6,664 | $27,629 | $4,504 | $23,125 |
| 2017 | $6,571 | $27,629 | $4,504 | $23,125 |
| 2016 | $7,126 | $27,629 | $4,504 | $23,125 |
| 2015 | $7,357 | $26,569 | $4,004 | $22,565 |
| 2014 | $7,284 | $26,569 | $4,004 | $22,565 |
| 2013 | $7,080 | $26,569 | $4,004 | $22,565 |
Source: Public Records
Map
Nearby Homes
- 133 W King George Ct Unit 1
- 1113 N Smith St
- 1065 N Smith St
- 1342 N Wellington Ct
- 1109 N Thackeray Dr
- 1309 W Dundee Rd
- 1553 N Saint Marks Place
- 358 W Birchwood Ave
- 1535 N Elm St
- 414 E Thornhill Ln Unit 4S414
- 219 E Reseda Pkwy
- 230 W Golfview Terrace
- 1288 N Ashland Ave Unit 1
- 1512 N Waterbury Cir Unit 7Q1
- 524 E Knox St
- 1527 Louise Ln
- 564 E Princeton St
- 522 E Juniper Dr
- 234 W Jennifer Ln Unit 33A
- 966 N Auburn Woods Dr
- 1123 N King Charles Ct
- 1111 N King Charles Ct
- 1146 N Old Mill Rd
- 1129 N King Charles Ct
- 1105 N King Charles Ct
- 1150 N Old Mill Rd
- 1140 N Old Mill Rd Unit 2
- 1135 N King Charles Ct
- 1116 N King Charles Ct
- 1099 N King Charles Ct
- 1122 N King Charles Ct
- 1134 N Old Mill Rd
- 1154 N Old Mill Rd
- 1110 N King Charles Ct
- 1104 N King Charles Ct
- 13 E Garden Ave
- 1134 N King Charles Ct
- 1093 N King Charles Ct
- 1128 N Old Mill Rd
- 1139 N King Charles Ct