
Seller's Agent in 2019
Ronald Trzcinski
Samson Properties
(410) 935-5844
1 in this area
28 Total Sales
Estimated Value: $145,000 - $171,939
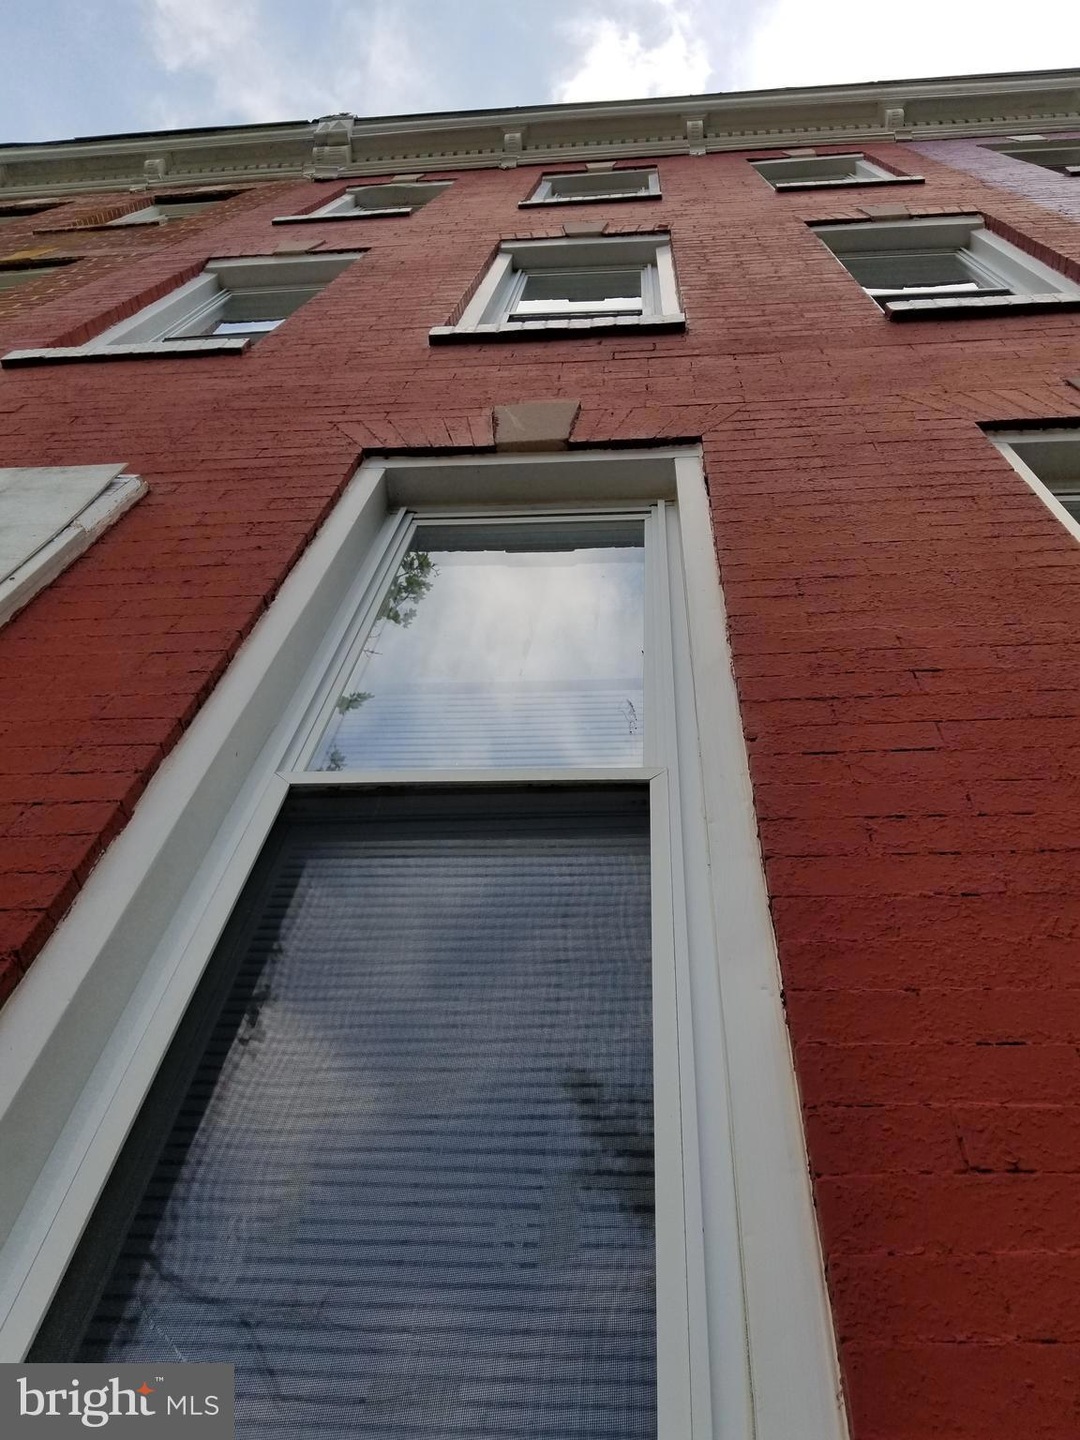
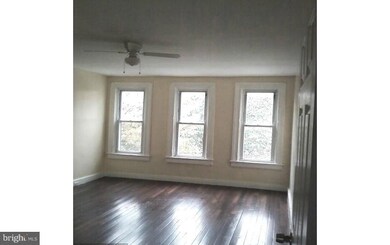
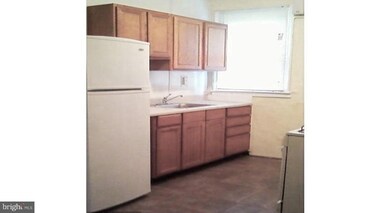
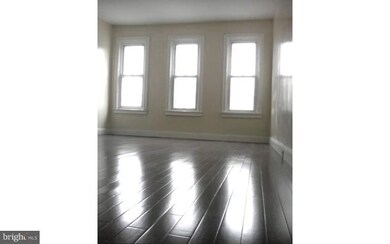
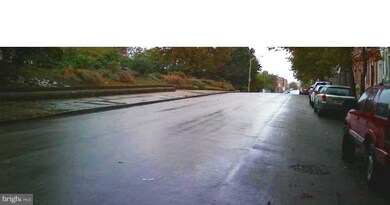
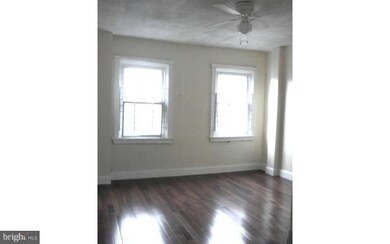
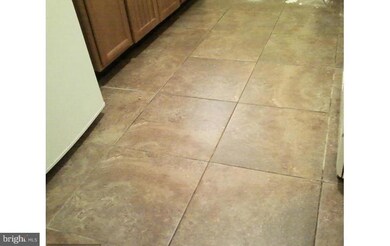
Brick front row house with traditional Baltimore marble steps -- 4 fully finished levels -- 4 bedrooms and 2 full baths -- hardwood floors -- warm and soothing gas heat -- ceiling fans - privacy fenced back yard -- Updated Electric and Plumbing, just resealed and resurfaced roof, and just serviced heating system -- Double pane windows -- Close to public transportation including buses, light rail, and the subway -- Major colleges such as University of Baltimore, MICA, and Coppin State are all within about 1 mile -- Just a couple of miles to Downtown Baltimore, including the Inner Harbor Attractions, Oriole Park, and Ravens Stadium -- MOVE RIGHT IN; IT'S READY!!
Last Agent to Sell the Property
(443) 317-8125 zenithret@gmail.com Samson Properties License #634480 Listed on: 05/23/2018
| Date | Buyer | Sale Price | Title Company |
|---|---|---|---|
| Mckie Aaliya Cummings | $1,800 | Lakeside Title Co | |
| Mckie Aaliya Cummings | $75,000 | Lakeside Title Company | |
| Bom Llc | $9,000 | -- | |
| Wells Fargo Bank Na | $63,158 | -- | |
| Wawrzyniak Joseph | $64,000 | -- | |
| Karta Co Inc | $5,500 | -- | |
| Bayview Financial Acquistion | $42,272 | -- | |
| Goode Robert H | $45,000 | -- | |
| H & L Enterprises Inc | -- | -- | |
| B & T Rental Properties L L C | $6,500 | -- |
| Date | Status | Borrower | Loan Amount |
|---|---|---|---|
| Previous Owner | Mckie Aaliya Cummings | $68,000 |
| Date | Event | Price | List to Sale | Price per Sq Ft |
|---|---|---|---|---|
| 10/31/2019 10/31/19 | Sold | $75,000 | -5.7% | $33 / Sq Ft |
| 10/24/2019 10/24/19 | Price Changed | $79,499 | 0.0% | $35 / Sq Ft |
| 10/08/2019 10/08/19 | Price Changed | $79,500 | -0.5% | $35 / Sq Ft |
| 10/03/2019 10/03/19 | Pending | -- | -- | -- |
| 06/23/2019 06/23/19 | Price Changed | $79,898 | 0.0% | $35 / Sq Ft |
| 06/03/2019 06/03/19 | Price Changed | $79,899 | 0.0% | $35 / Sq Ft |
| 04/24/2019 04/24/19 | Price Changed | $79,900 | -6.0% | $35 / Sq Ft |
| 04/02/2019 04/02/19 | Price Changed | $85,000 | -5.6% | $37 / Sq Ft |
| 03/18/2019 03/18/19 | Price Changed | $89,999 | -5.3% | $39 / Sq Ft |
| 03/11/2019 03/11/19 | Price Changed | $95,000 | -2.0% | $41 / Sq Ft |
| 02/14/2019 02/14/19 | Price Changed | $96,985 | 0.0% | $42 / Sq Ft |
| 01/14/2019 01/14/19 | Price Changed | $97,000 | -0.5% | $42 / Sq Ft |
| 01/11/2019 01/11/19 | Price Changed | $97,500 | -1.0% | $42 / Sq Ft |
| 01/10/2019 01/10/19 | For Sale | $98,479 | +31.3% | $43 / Sq Ft |
| 01/01/2019 01/01/19 | Off Market | $75,000 | -- | -- |
| 12/27/2018 12/27/18 | Price Changed | $98,479 | 0.0% | $43 / Sq Ft |
| 12/20/2018 12/20/18 | Price Changed | $98,499 | 0.0% | $43 / Sq Ft |
| 11/23/2018 11/23/18 | Price Changed | $98,500 | -0.5% | $43 / Sq Ft |
| 11/21/2018 11/21/18 | Price Changed | $98,998 | 0.0% | $43 / Sq Ft |
| 09/30/2018 09/30/18 | Price Changed | $98,999 | 0.0% | $43 / Sq Ft |
| 08/01/2018 08/01/18 | Price Changed | $99,000 | -0.9% | $43 / Sq Ft |
| 07/09/2018 07/09/18 | Price Changed | $99,873 | 0.0% | $43 / Sq Ft |
| 07/05/2018 07/05/18 | Price Changed | $99,874 | 0.0% | $43 / Sq Ft |
| 06/27/2018 06/27/18 | Price Changed | $99,875 | 0.0% | $43 / Sq Ft |
| 06/21/2018 06/21/18 | Price Changed | $99,899 | 0.0% | $43 / Sq Ft |
| 06/18/2018 06/18/18 | Price Changed | $99,900 | -0.1% | $43 / Sq Ft |
| 06/16/2018 06/16/18 | Price Changed | $99,990 | 0.0% | $43 / Sq Ft |
| 06/10/2018 06/10/18 | Price Changed | $99,999 | 0.0% | $43 / Sq Ft |
| 05/23/2018 05/23/18 | For Sale | $100,000 | 0.0% | $43 / Sq Ft |
| 01/01/2017 01/01/17 | Rented | $1,000 | -37.5% | -- |
| 01/01/2017 01/01/17 | Under Contract | -- | -- | -- |
| 04/29/2016 04/29/16 | For Rent | $1,600 | +14.3% | -- |
| 03/04/2015 03/04/15 | Rented | $1,400 | 0.0% | -- |
| 03/04/2015 03/04/15 | Under Contract | -- | -- | -- |
| 02/26/2015 02/26/15 | For Rent | $1,400 | -- | -- |
| Year | Tax Paid | Tax Assessment Tax Assessment Total Assessment is a certain percentage of the fair market value that is determined by local assessors to be the total taxable value of land and additions on the property. | Land | Improvement |
|---|---|---|---|---|
| 2025 | $1,804 | $83,400 | -- | -- |
| 2024 | $1,804 | $76,800 | -- | -- |
| 2023 | $1,657 | $70,200 | $14,000 | $56,200 |
| 2022 | $1,340 | $56,800 | $0 | $0 |
| 2021 | $1,024 | $43,400 | $0 | $0 |
| 2020 | $708 | $30,000 | $7,000 | $23,000 |
| 2019 | $705 | $30,000 | $7,000 | $23,000 |
| 2018 | $708 | $30,000 | $7,000 | $23,000 |
| 2017 | $944 | $40,000 | $0 | $0 |
| 2016 | $334 | $31,367 | $0 | $0 |
| 2015 | $334 | $22,733 | $0 | $0 |
| 2014 | $334 | $14,100 | $0 | $0 |
Seller's Agent in 2019
Ronald Trzcinski
Samson Properties
(410) 935-5844
1 in this area
28 Total Sales
Buyer's Agent in 2019
Ali Haghgoo
EXP Realty, LLC
(410) 340-4165
407 Total Sales
Seller's Agent in 2015
Creig Northrop
Creig Northrop Team of Long & Foster
(410) 884-8354
594 Total Sales
J
Seller Co-Listing Agent in 2015
James Turner
Long & Foster
Source: Bright MLS
MLS Number: 1001544094
APN: 0042-074
Disclaimer: Certain information contained herein is derived from information provided by parties other than Homes.com. All information provided is deemed reliable, but is not guaranteed to be accurate and should be independently verified.
![]() The data relating to real estate for sale on this website appears in part through the BRIGHT Internet Data Exchange program, a voluntary cooperative exchange of property listing data between licensed real estate brokerage firms, and is provided by BRIGHT through a licensing agreement.
The data relating to real estate for sale on this website appears in part through the BRIGHT Internet Data Exchange program, a voluntary cooperative exchange of property listing data between licensed real estate brokerage firms, and is provided by BRIGHT through a licensing agreement.
Listing information is from various brokers who participate in the Bright MLS IDX program and not all listings may be visible on the site.
The property information being provided on or through the website is for the personal, non-commercial use of consumers and such information may not be used for any purpose other than to identify prospective properties consumers may be interested in purchasing.
Some properties which appear for sale on the website may no longer be available because they are for instance, under contract, sold or are no longer being offered for sale.
Property information displayed is deemed reliable but is not guaranteed.
Copyright 2026 Bright MLS, Inc.
Ask me questions while you tour the home.