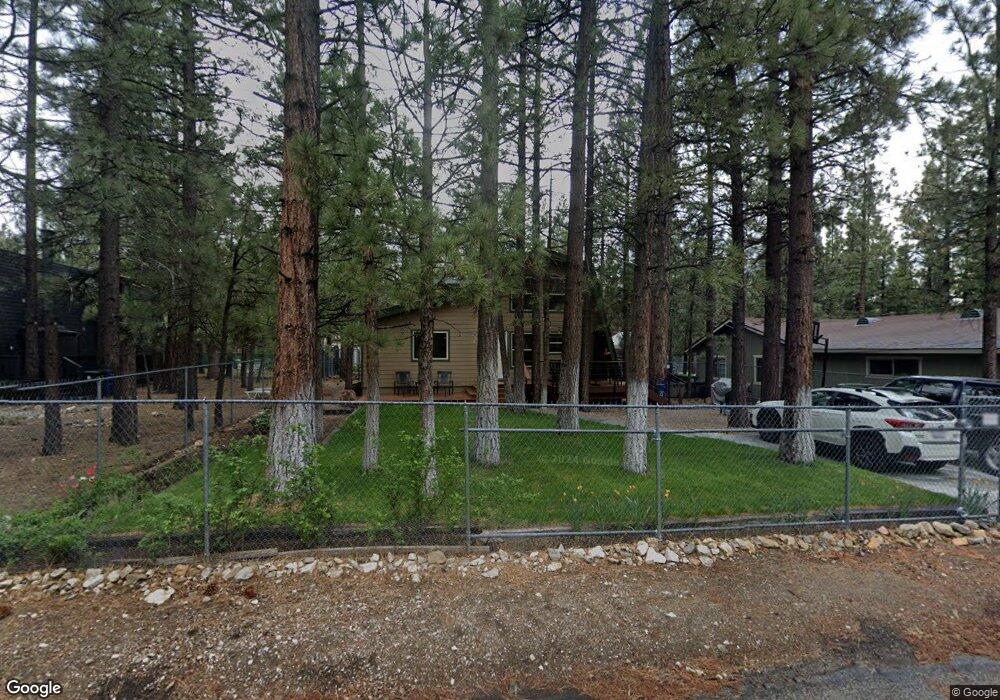
1117 Pine Ln Big Bear City, CA 92314
Estimated Value: $382,521 - $415,000
2
Beds
2
Baths
1,624
Sq Ft
$244/Sq Ft
Est. Value
About This Home
This home is located at 1117 Pine Ln, Big Bear City, CA 92314 and is currently estimated at $395,630, approximately $243 per square foot. 1117 Pine Ln is a home located in San Bernardino County with nearby schools including Baldwin Lane Elementary School, Big Bear Middle School, and Big Bear High School.
Ownership History
Date
Name
Owned For
Owner Type
Purchase Details
Closed on
Jun 8, 2017
Sold by
Griffiths David B
Bought by
Griffiths Lisa A and Griffiths David B
Current Estimated Value
Home Financials for this Owner
Home Financials are based on the most recent Mortgage that was taken out on this home.
Original Mortgage
$161,000
Outstanding Balance
$84,474
Interest Rate
4.02%
Mortgage Type
New Conventional
Estimated Equity
$311,156
Purchase Details
Closed on
Apr 2, 1998
Sold by
Neff Joyce N Trust
Bought by
Griffiths David B and Griffiths Lisa A
Home Financials for this Owner
Home Financials are based on the most recent Mortgage that was taken out on this home.
Original Mortgage
$74,480
Interest Rate
7.07%
Mortgage Type
Purchase Money Mortgage
Purchase Details
Closed on
Feb 25, 1994
Sold by
Neff Joyce N
Bought by
Joyce N Neff Trust Of 1994
Create a Home Valuation Report for This Property
The Home Valuation Report is an in-depth analysis detailing your home's value as well as a comparison with similar homes in the area
Home Values in the Area
Average Home Value in this Area
Purchase History
| Date | Buyer | Sale Price | Title Company |
|---|---|---|---|
| Griffiths Lisa A | -- | Ticor Title Company Of Ca | |
| Griffiths David B | $78,500 | Fidelity National Title Ins | |
| Joyce N Neff Trust Of 1994 | -- | -- |
Source: Public Records
Mortgage History
| Date | Status | Borrower | Loan Amount |
|---|---|---|---|
| Open | Griffiths Lisa A | $161,000 | |
| Previous Owner | Griffiths David B | $74,480 |
Source: Public Records
Tax History
| Year | Tax Paid | Tax Assessment Tax Assessment Total Assessment is a certain percentage of the fair market value that is determined by local assessors to be the total taxable value of land and additions on the property. | Land | Improvement |
|---|---|---|---|---|
| 2025 | $3,242 | $173,597 | $31,353 | $142,244 |
| 2024 | $3,127 | $170,193 | $30,738 | $139,455 |
| 2023 | $3,028 | $166,856 | $30,135 | $136,721 |
| 2022 | $2,679 | $163,584 | $29,544 | $134,040 |
| 2021 | $2,617 | $160,377 | $28,965 | $131,412 |
| 2020 | $2,614 | $158,733 | $28,668 | $130,065 |
| 2019 | $2,581 | $155,621 | $28,106 | $127,515 |
| 2018 | $2,482 | $152,570 | $27,555 | $125,015 |
| 2017 | $2,412 | $149,579 | $27,015 | $122,564 |
| 2016 | $2,350 | $146,646 | $26,485 | $120,161 |
| 2015 | $2,311 | $144,443 | $26,087 | $118,356 |
| 2014 | $2,264 | $141,614 | $25,576 | $116,038 |
Source: Public Records
Map
Nearby Homes
Your Personal Tour Guide
Ask me questions while you tour the home.