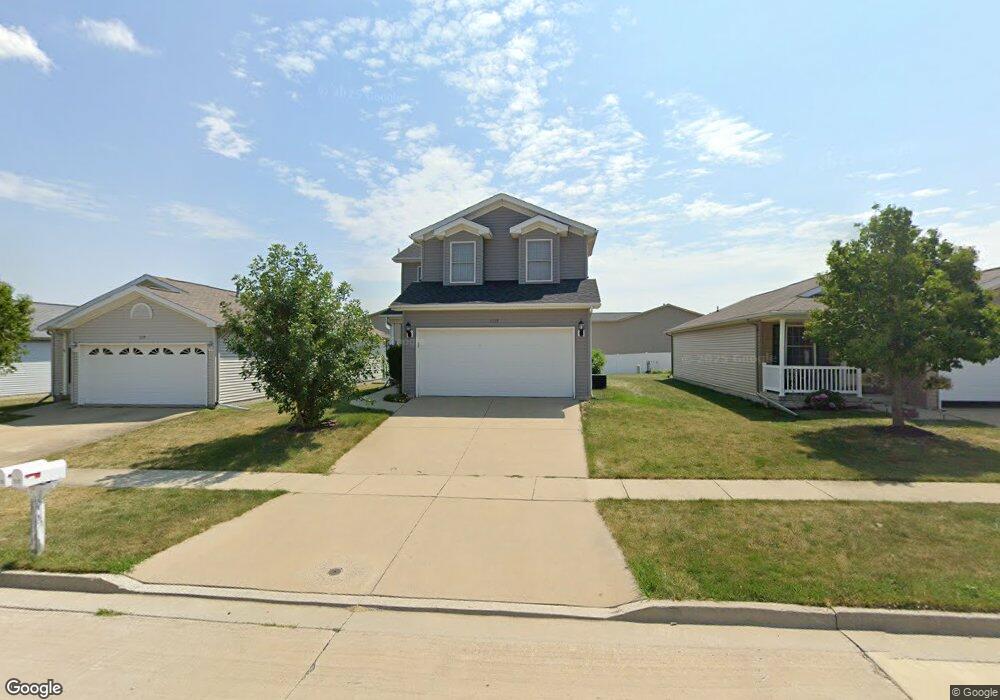
1117 Rader Run Bloomington, IL 61704
Estimated Value: $259,000 - $279,902
4
Beds
3
Baths
2,187
Sq Ft
$122/Sq Ft
Est. Value
About This Home
This home is located at 1117 Rader Run, Bloomington, IL 61704 and is currently estimated at $265,976, approximately $121 per square foot. 1117 Rader Run is a home located in McLean County with nearby schools including Benjamin Elementary School, Evans Junior High School, and Normal Community High School.
Ownership History
Date
Name
Owned For
Owner Type
Purchase Details
Closed on
Aug 15, 2008
Sold by
Bethel Bambi R
Bought by
Gurrala Satish and Gurrala Madhuri
Current Estimated Value
Home Financials for this Owner
Home Financials are based on the most recent Mortgage that was taken out on this home.
Original Mortgage
$124,800
Outstanding Balance
$77,956
Interest Rate
5.37%
Estimated Equity
$188,020
Purchase Details
Closed on
Jun 14, 2007
Sold by
Altenburg Tod J and Altenburg Alisa J
Bought by
Bethel Bambi
Home Financials for this Owner
Home Financials are based on the most recent Mortgage that was taken out on this home.
Original Mortgage
$163,300
Interest Rate
6.2%
Purchase Details
Closed on
Apr 1, 2005
Sold by
Watson Robert D
Bought by
Altenburg Tod J and Altenburg Alisa J
Home Financials for this Owner
Home Financials are based on the most recent Mortgage that was taken out on this home.
Original Mortgage
$119,400
Interest Rate
5.85%
Mortgage Type
Adjustable Rate Mortgage/ARM
Create a Home Valuation Report for This Property
The Home Valuation Report is an in-depth analysis detailing your home's value as well as a comparison with similar homes in the area
Purchase History
| Date | Buyer | Sale Price | Title Company |
|---|---|---|---|
| Gurrala Satish | $156,000 | None Available | |
| Bethel Bambi | $172,000 | None Available | |
| Altenburg Tod J | $149,500 | None Available |
Source: Public Records
Mortgage History
| Date | Status | Borrower | Loan Amount |
|---|---|---|---|
| Open | Gurrala Satish | $124,800 | |
| Previous Owner | Bethel Bambi | $163,300 | |
| Previous Owner | Altenburg Tod J | $119,400 |
Source: Public Records
Tax History
| Year | Tax Paid | Tax Assessment Tax Assessment Total Assessment is a certain percentage of the fair market value that is determined by local assessors to be the total taxable value of land and additions on the property. | Land | Improvement |
|---|---|---|---|---|
| 2024 | $4,771 | $80,550 | $15,195 | $65,355 |
| 2022 | $4,771 | $59,993 | $11,317 | $48,676 |
| 2021 | $4,374 | $54,920 | $10,360 | $44,560 |
| 2020 | $4,246 | $53,424 | $10,078 | $43,346 |
| 2019 | $4,029 | $52,516 | $9,907 | $42,609 |
| 2018 | $3,936 | $51,487 | $9,713 | $41,774 |
| 2017 | $3,776 | $51,487 | $9,713 | $41,774 |
| 2016 | $3,766 | $51,487 | $9,713 | $41,774 |
| 2015 | $3,774 | $51,580 | $9,731 | $41,849 |
| 2014 | $3,732 | $51,580 | $9,731 | $41,849 |
| 2013 | -- | $51,580 | $9,731 | $41,849 |
Source: Public Records
Map
Nearby Homes
- 1304 Woodbine Rd
- 3715 Wine Way
- 1407 Windham Hill Rd Unit 1407
- 16 Grape Vine Ln
- 15 Greythorne Cir
- 8 Stone Mill Ct
- 7 Melrose Ct
- 67 Dry Sage Cir
- 1204 Kim Dr
- 1 Windsong Way
- 24 Stonehouse Ct
- 1913 Woodbine Rd
- 1305 Nicki Dr
- 1 Worthington Ct
- 1312 Nicki Dr
- 7 Smokey Ct
- 54 Yukon Cir
- 2020 Escalade Rd
- 3916 Anabelle Dr
- 2810 Arrowhead Dr
- 1119 Rader Run
- 1115 Rader Run
- 1121 Rader Run
- 1113 Rader Run
- 1110 Ekstam#4
- 1110 Ekstam#3
- 1123 Rader Run
- 1110 Ekstam Dr
- 1110 Ekstam Dr Unit 1
- 1110 Ekstam Dr Unit 3
- 1110 Ekstam Dr Unit 4
- 1110 Ekstam Dr Unit 2
- 1112 Ekstam #1
- 1112 Ekstam #4
- 1112 Ekstam #2
- 1112 Ekstam Dr
- 1112 Ekstam Dr Unit 1
- 1112 Ekstam Dr Unit 4
- 1112 Ekstam Dr Unit 2
- 1112 Ekstam Dr Unit 3
Your Personal Tour Guide
Ask me questions while you tour the home.