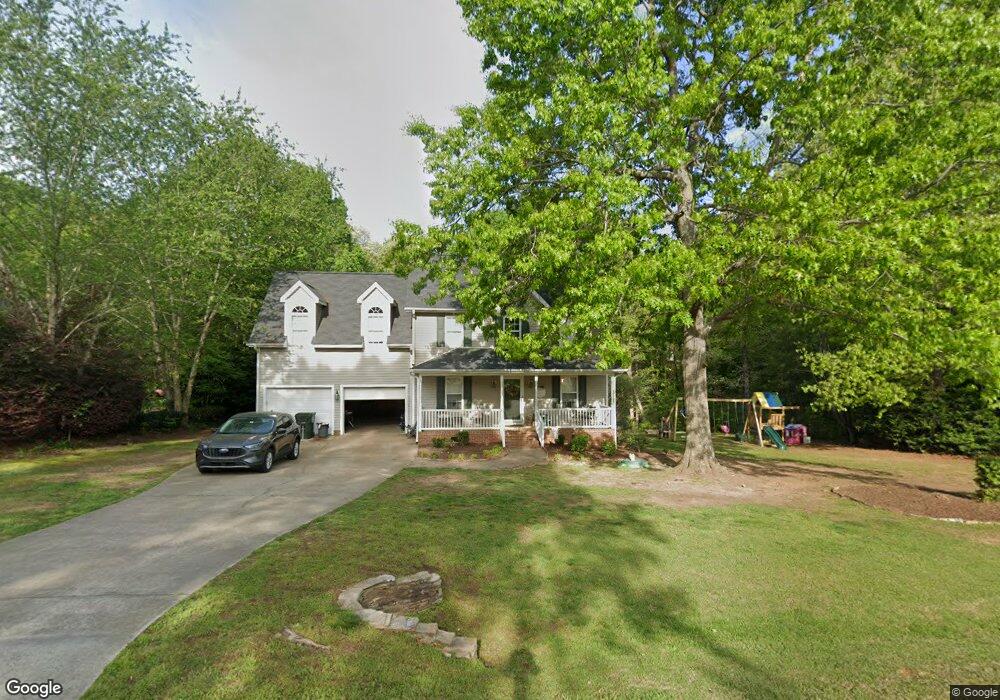
1117 Red Brick Rd Garner, NC 27529
Estimated Value: $402,000 - $432,000
3
Beds
3
Baths
1,980
Sq Ft
$212/Sq Ft
Est. Value
About This Home
This home is located at 1117 Red Brick Rd, Garner, NC 27529 and is currently estimated at $420,255, approximately $212 per square foot. 1117 Red Brick Rd is a home located in Wake County with nearby schools including Aversboro Elementary, East Garner Middle School, and South Garner High.
Ownership History
Date
Name
Owned For
Owner Type
Purchase Details
Closed on
Mar 4, 2019
Sold by
Hinton Douglas V and Hinton Brenda Ann
Bought by
Norris Taylor Bailey and Norris William W
Current Estimated Value
Home Financials for this Owner
Home Financials are based on the most recent Mortgage that was taken out on this home.
Original Mortgage
$220,675
Outstanding Balance
$194,011
Interest Rate
4.4%
Mortgage Type
New Conventional
Estimated Equity
$226,244
Purchase Details
Closed on
Nov 4, 2005
Sold by
Derrenbacher Christopher J and Derrenbacher Christy L
Bought by
Hinton Douglas
Purchase Details
Closed on
May 28, 1999
Sold by
Stafford Custom Homes Inc
Bought by
Derrenbacher Christopher J and Derrenbacher Christy L
Home Financials for this Owner
Home Financials are based on the most recent Mortgage that was taken out on this home.
Original Mortgage
$184,870
Interest Rate
6.9%
Purchase Details
Closed on
Aug 25, 1998
Sold by
Stafford Land Company Inc
Bought by
Stafford Custom Homes Inc
Create a Home Valuation Report for This Property
The Home Valuation Report is an in-depth analysis detailing your home's value as well as a comparison with similar homes in the area
Home Values in the Area
Average Home Value in this Area
Purchase History
| Date | Buyer | Sale Price | Title Company |
|---|---|---|---|
| Norris Taylor Bailey | $227,500 | None Available | |
| Hinton Douglas | $210,000 | None Available | |
| Derrenbacher Christopher J | $197,500 | -- | |
| Stafford Custom Homes Inc | $199,000 | -- |
Source: Public Records
Mortgage History
| Date | Status | Borrower | Loan Amount |
|---|---|---|---|
| Open | Norris Taylor Bailey | $220,675 | |
| Previous Owner | Derrenbacher Christopher J | $184,870 |
Source: Public Records
Tax History
| Year | Tax Paid | Tax Assessment Tax Assessment Total Assessment is a certain percentage of the fair market value that is determined by local assessors to be the total taxable value of land and additions on the property. | Land | Improvement |
|---|---|---|---|---|
| 2025 | $2,535 | $393,195 | $90,000 | $303,195 |
| 2024 | $2,462 | $393,195 | $90,000 | $303,195 |
Source: Public Records
Map
Nearby Homes
- 1017 Southern Trace Trail
- 1205 Magnolia Hill Rd
- 5412 Treebound Ct
- 1328 Red Brick Rd
- 1004 Cabin Hill Way
- 5405 Massengill Ct
- 3760 Wakefield Ln
- 1025 Saint Lawrence Dr
- 1029 Saint Lawrence Dr
- 1033 Saint Lawrence Dr
- 1021 Saint Lawrence Dr
- 1017 Saint Lawrence Dr
- 1037 Saint Lawrence Dr
- 1005 Saint Lawrence Dr
- 1009 Saint Lawrence Dr
- 1001 Saint Lawrence Dr
- 221 Sprenger St
- 229 Sprenger St
- 264 Yellow River Way
- 936 Grand Mesa Dr
- 1113 Red Brick Rd
- 1121 Red Brick Rd
- 1116 Red Brick Rd
- 1213 Southern Trace Trail
- 1109 Red Brick Rd
- 1112 Red Brick Rd
- 174 Southern Trace
- 116 Southern Trace
- 1108 Red Brick Rd
- 1209 Southern Trace Trail
- 1101 Red Brick Rd
- 1212 Southern Trace Trail
- 1304 Southern Trace Trail
- 1201 Red Brick Rd
- 1305 Southern Trace Trail
- 1201 Southern Trace Trail
- 5101 Cotton Boll Ct
- 1204 Red Brick Rd
- 1208 Southern Trace Trail
- 1041 Red Brick Rd
Your Personal Tour Guide
Ask me questions while you tour the home.