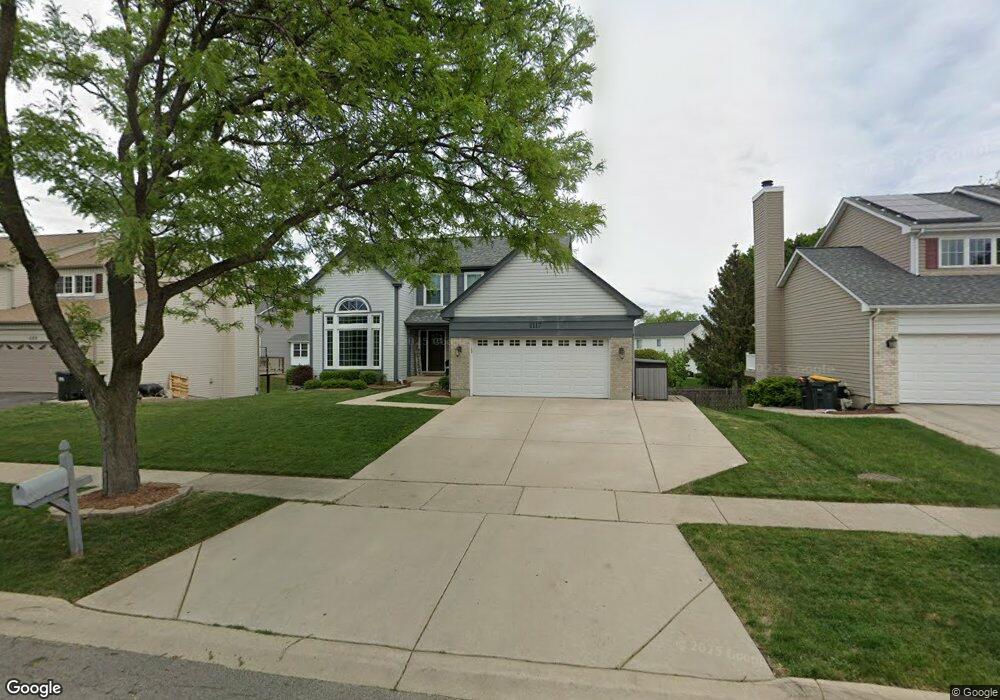
1117 Regency Ln Carol Stream, IL 60188
Estimated Value: $487,000 - $569,000
4
Beds
6
Baths
2,220
Sq Ft
$236/Sq Ft
Est. Value
About This Home
This home is located at 1117 Regency Ln, Carol Stream, IL 60188 and is currently estimated at $524,083, approximately $236 per square foot. 1117 Regency Ln is a home located in DuPage County with nearby schools including Heritage Lakes Elementary School, Jay Stream Middle School, and Glenbard North High School.
Ownership History
Date
Name
Owned For
Owner Type
Purchase Details
Closed on
Nov 6, 2011
Sold by
Ehrhard William R and Ehrhard Madeline
Bought by
Mohawk Capital Management 401K Plan
Current Estimated Value
Home Financials for this Owner
Home Financials are based on the most recent Mortgage that was taken out on this home.
Original Mortgage
$232,800
Interest Rate
3.95%
Mortgage Type
New Conventional
Purchase Details
Closed on
May 10, 2006
Sold by
Ehrhard William R
Bought by
Ehrhard William R and Ehrhard Madeline
Home Financials for this Owner
Home Financials are based on the most recent Mortgage that was taken out on this home.
Original Mortgage
$271,600
Interest Rate
7.99%
Mortgage Type
Purchase Money Mortgage
Create a Home Valuation Report for This Property
The Home Valuation Report is an in-depth analysis detailing your home's value as well as a comparison with similar homes in the area
Home Values in the Area
Average Home Value in this Area
Purchase History
| Date | Buyer | Sale Price | Title Company |
|---|---|---|---|
| Mohawk Capital Management 401K Plan | $220,000 | Git | |
| Ehrhard William R | -- | Law Title Insurance |
Source: Public Records
Mortgage History
| Date | Status | Borrower | Loan Amount |
|---|---|---|---|
| Previous Owner | Mohawk Capital Management 401K Plan | $232,800 | |
| Previous Owner | Ehrhard William R | $271,600 |
Source: Public Records
Tax History
| Year | Tax Paid | Tax Assessment Tax Assessment Total Assessment is a certain percentage of the fair market value that is determined by local assessors to be the total taxable value of land and additions on the property. | Land | Improvement |
|---|---|---|---|---|
| 2024 | $11,810 | $145,700 | $38,522 | $107,178 |
| 2023 | $11,101 | $132,190 | $34,950 | $97,240 |
| 2022 | $10,781 | $122,850 | $32,480 | $90,370 |
| 2021 | $10,278 | $116,620 | $30,830 | $85,790 |
| 2020 | $10,059 | $113,130 | $29,910 | $83,220 |
| 2019 | $9,690 | $109,090 | $28,840 | $80,250 |
| 2018 | $9,633 | $109,880 | $29,050 | $80,830 |
| 2017 | $10,031 | $111,610 | $29,050 | $82,560 |
| 2016 | $9,852 | $106,610 | $27,750 | $78,860 |
| 2015 | $9,786 | $100,920 | $26,270 | $74,650 |
| 2014 | $9,321 | $94,890 | $25,600 | $69,290 |
| 2013 | $9,264 | $97,160 | $26,210 | $70,950 |
Source: Public Records
Map
Nearby Homes
- 909 Hampton Dr
- 1179 Edington Ct
- 880 Hampton Dr
- 3758 Merrimac Ln W
- 1418 Merrimac Ln S
- 577 Canterbury Dr Unit 18C
- 461 Canterbury Dr Unit 13E
- 1390 Merrimac Ln N
- 450 Hunter Dr
- 1308 Coldspring Rd Unit 7
- 1060 Cliff View Ln
- 418 Waterford Ct Unit 154
- 397 Waterford Ct Unit 178
- 770 Birchbark Trail
- 862 Omaha Ct
- 3945 County Farm Rd
- 352 Kildare Ct Unit 222A
- 1266 Seabury Cir
- 848 Birchbark Trail
- 1122 Bradbury Cir
- 1113 Regency Ln
- 1123 Regency Ln
- 768 Huntington Dr
- 1107 Regency Ln
- 755 Warwick Ct
- 756 Warwick Ct
- 764 Huntington Dr
- 1116 Regency Ln
- 1122 Regency Ln
- 1112 Regency Ln
- 1101 Regency Ln
- 1124 Regency Ln
- 1106 Regency Ln
- 773 Huntington Dr
- 760 Huntington Dr
- 753 Warwick Ct
- 769 Huntington Dr
- 754 Warwick Ct
- 1132 Regency Ln
- 1091 Regency Ln
Your Personal Tour Guide
Ask me questions while you tour the home.