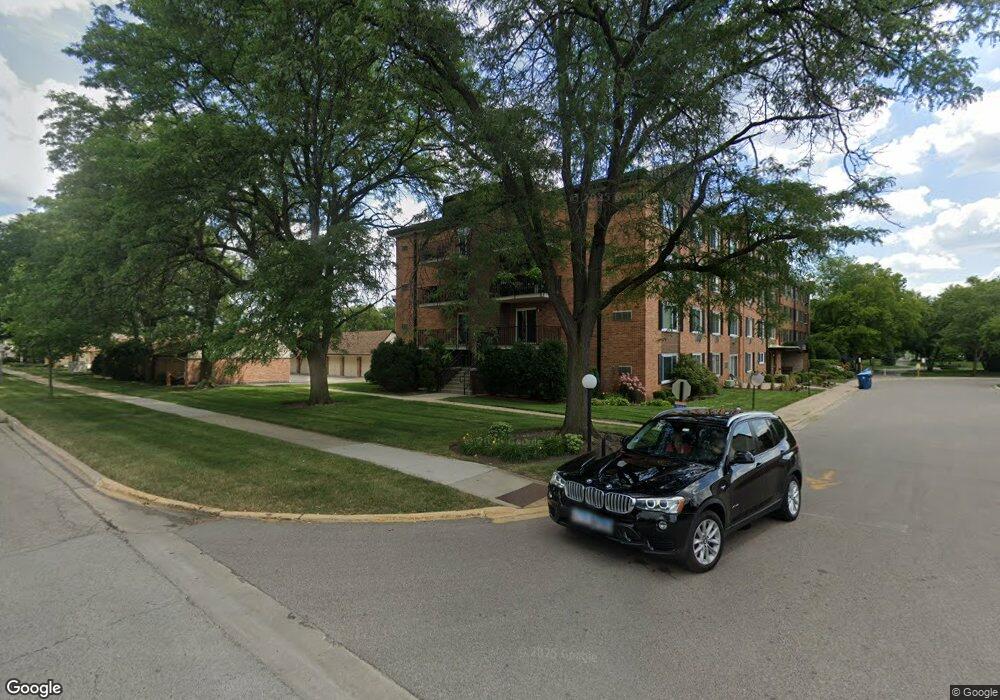
1117 S Old Wilke Rd Unit 5403 Arlington Heights, IL 60005
Busse Woods NeighborhoodEstimated Value: $162,212 - $188,000
1
Bed
1
Bath
800
Sq Ft
$219/Sq Ft
Est. Value
About This Home
This home is located at 1117 S Old Wilke Rd Unit 5403, Arlington Heights, IL 60005 and is currently estimated at $174,803, approximately $218 per square foot. 1117 S Old Wilke Rd Unit 5403 is a home located in Cook County with nearby schools including Willow Bend Elementary School, Gale School, and King Elementary School.
Ownership History
Date
Name
Owned For
Owner Type
Purchase Details
Closed on
Feb 1, 2022
Sold by
Berendson Laura and The Laura Berendson Rev Trust
Bought by
Kramarz Eliza
Current Estimated Value
Purchase Details
Closed on
May 22, 2002
Sold by
Berendson Laura
Bought by
Berendson Laura and Laura Berendson Revocable Trust
Purchase Details
Closed on
Nov 21, 2001
Sold by
Winters Maximilian J
Bought by
Berendson Laura C
Home Financials for this Owner
Home Financials are based on the most recent Mortgage that was taken out on this home.
Original Mortgage
$65,000
Interest Rate
6.6%
Purchase Details
Closed on
Dec 23, 1998
Sold by
Mallard Cove Investors Llc
Bought by
Winters Maximilian J
Home Financials for this Owner
Home Financials are based on the most recent Mortgage that was taken out on this home.
Original Mortgage
$80,700
Interest Rate
6.76%
Mortgage Type
FHA
Create a Home Valuation Report for This Property
The Home Valuation Report is an in-depth analysis detailing your home's value as well as a comparison with similar homes in the area
Home Values in the Area
Average Home Value in this Area
Purchase History
| Date | Buyer | Sale Price | Title Company |
|---|---|---|---|
| Kramarz Eliza | $114,000 | -- | |
| Berendson Laura | -- | -- | |
| Berendson Laura C | $112,000 | Commonwealth Land Title Ins | |
| Winters Maximilian J | $85,000 | 1St American Title |
Source: Public Records
Mortgage History
| Date | Status | Borrower | Loan Amount |
|---|---|---|---|
| Previous Owner | Berendson Laura C | $65,000 | |
| Previous Owner | Winters Maximilian J | $80,700 |
Source: Public Records
Tax History Compared to Growth
Tax History
| Year | Tax Paid | Tax Assessment Tax Assessment Total Assessment is a certain percentage of the fair market value that is determined by local assessors to be the total taxable value of land and additions on the property. | Land | Improvement |
|---|---|---|---|---|
| 2024 | $3,009 | $10,640 | $1,626 | $9,014 |
| 2023 | $2,883 | $10,640 | $1,626 | $9,014 |
| 2022 | $2,883 | $10,640 | $1,626 | $9,014 |
| 2021 | $1,548 | $8,341 | $1,066 | $7,275 |
| 2020 | $1,578 | $8,341 | $1,066 | $7,275 |
| 2019 | $1,599 | $9,350 | $1,066 | $8,284 |
| 2018 | $724 | $5,865 | $914 | $4,951 |
| 2017 | $730 | $5,865 | $914 | $4,951 |
| 2016 | $920 | $5,865 | $914 | $4,951 |
| 2015 | $898 | $5,643 | $812 | $4,831 |
| 2014 | $1,316 | $7,067 | $812 | $6,255 |
| 2013 | $1,266 | $7,067 | $812 | $6,255 |
Source: Public Records
Map
Nearby Homes
- 1117 S Old Wilke Rd Unit 206
- 1107 S Old Wilke Rd Unit 201
- 1126 S New Wilke Rd Unit 307
- 1207 S Old Wilke Rd Unit 303
- 1206 S New Wilke Rd Unit 108
- 1217 S Old Wilke Rd Unit 11110
- 1217 S Old Wilke Rd Unit 11406
- 1227 S Old Wilke Rd Unit 201
- 1227 S Old Wilke Rd Unit 306
- 2312 Algonquin Rd Unit 3
- 2303 Fulle St
- 1306 S New Wilke Rd Unit 2B
- 1322 S New Wilke Rd Unit 1C
- 2508 Algonquin Rd Unit 16
- 2503 Fulle St Unit 17
- 1602 W Orchard Place Unit 1602C
- 2402 Algonquin Rd Unit 9
- 3805 Wren Ln
- 2504 Algonquin Rd Unit 14
- 2504 Algonquin Rd Unit 17
- 1117 S Old Wilke Rd Unit 305
- 1117 S Old Wilke Rd Unit 101
- 1117 S Old Wilke Rd Unit 110
- 1117 S Old Wilke Rd Unit 210
- 1117 S Old Wilke Rd Unit 308
- 1117 S Old Wilke Rd Unit 5208
- 1117 S Old Wilke Rd Unit 5303
- 1117 S Old Wilke Rd Unit 5304
- 1117 S Old Wilke Rd Unit 5406
- 1117 S Old Wilke Rd Unit G201
- 1117 S Old Wilke Rd Unit 5201
- 1117 S Old Wilke Rd Unit 5203
- 1117 S Old Wilke Rd Unit G193
- 1117 S Old Wilke Rd Unit G165
- 1117 S Old Wilke Rd Unit G188
- 1117 S Old Wilke Rd Unit G173
- 1117 S Old Wilke Rd Unit 5402
- 1117 S Old Wilke Rd Unit G196
- 1117 S Old Wilke Rd Unit G212
- 1117 S Old Wilke Rd Unit G202