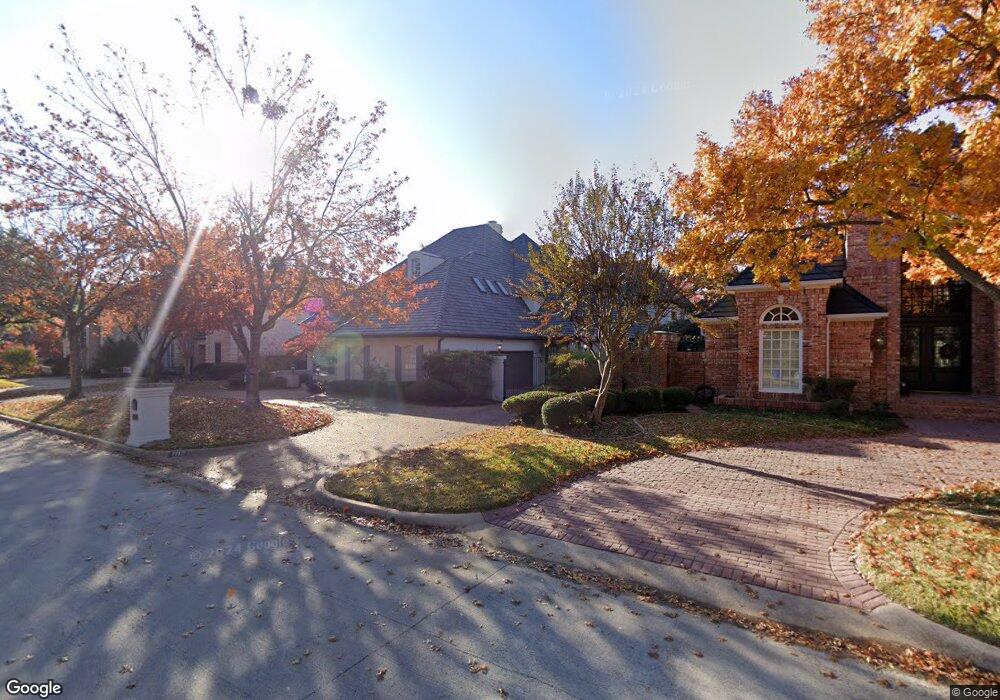
1117 Somerset Blvd Colleyville, TX 76034
Estimated Value: $1,380,000 - $1,553,000
5
Beds
6
Baths
6,060
Sq Ft
$245/Sq Ft
Est. Value
About This Home
This home is located at 1117 Somerset Blvd, Colleyville, TX 76034 and is currently estimated at $1,487,455, approximately $245 per square foot. 1117 Somerset Blvd is a home located in Tarrant County with nearby schools including Bransford Elementary School, Colleyville Middle School, and Covenant Christian Academy.
Ownership History
Date
Name
Owned For
Owner Type
Purchase Details
Closed on
Jun 3, 2020
Sold by
Parks Jennifer A
Bought by
Dickson Jason K and Dickson Lauren
Current Estimated Value
Home Financials for this Owner
Home Financials are based on the most recent Mortgage that was taken out on this home.
Original Mortgage
$510,400
Outstanding Balance
$453,274
Interest Rate
3.3%
Mortgage Type
New Conventional
Estimated Equity
$1,034,181
Purchase Details
Closed on
Feb 26, 2019
Sold by
Parks Jennifer A and Parks Shane P
Bought by
Parks Jennifer A
Purchase Details
Closed on
May 6, 2010
Sold by
Parks Jennifer A and Parks Shane P
Bought by
Parks Jennifer A and Parks Shane P
Purchase Details
Closed on
Sep 28, 1995
Sold by
Kennedy James J and Kennedy Suzanne N
Bought by
Parks Maurice E and Parks Jennifer A
Home Financials for this Owner
Home Financials are based on the most recent Mortgage that was taken out on this home.
Original Mortgage
$504,698
Interest Rate
7.88%
Create a Home Valuation Report for This Property
The Home Valuation Report is an in-depth analysis detailing your home's value as well as a comparison with similar homes in the area
Home Values in the Area
Average Home Value in this Area
Purchase History
| Date | Buyer | Sale Price | Title Company |
|---|---|---|---|
| Dickson Jason K | -- | Chicago Title | |
| Parks Jennifer A | -- | None Available | |
| Parks Jennifer A | -- | None Available | |
| Parks Maurice E | -- | First American Title Co |
Source: Public Records
Mortgage History
| Date | Status | Borrower | Loan Amount |
|---|---|---|---|
| Open | Dickson Jason K | $510,400 | |
| Previous Owner | Parks Maurice E | $504,698 |
Source: Public Records
Tax History Compared to Growth
Tax History
| Year | Tax Paid | Tax Assessment Tax Assessment Total Assessment is a certain percentage of the fair market value that is determined by local assessors to be the total taxable value of land and additions on the property. | Land | Improvement |
|---|---|---|---|---|
| 2025 | $5,350 | $1,439,055 | $293,075 | $1,145,980 |
| 2024 | $5,350 | $1,439,055 | $293,075 | $1,145,980 |
| 2023 | $20,151 | $1,447,696 | $293,075 | $1,154,621 |
| 2022 | $21,448 | $1,135,537 | $293,075 | $842,462 |
| 2021 | $21,681 | $987,245 | $175,845 | $811,400 |
| 2020 | $17,854 | $803,482 | $175,845 | $627,637 |
| 2019 | $18,929 | $818,742 | $188,100 | $630,642 |
| 2018 | $4,492 | $755,620 | $188,100 | $567,520 |
| 2017 | $17,782 | $752,692 | $198,000 | $554,692 |
| 2016 | $21,432 | $907,204 | $198,000 | $709,204 |
| 2015 | $16,386 | $707,100 | $102,000 | $605,100 |
| 2014 | $16,386 | $707,100 | $102,000 | $605,100 |
Source: Public Records
Map
Nearby Homes
- 4516 Dartmoore Ln
- 4600 Westbury Dr
- 4105 Inwood Ln
- 4600 Stafford Dr
- 4812 Carmel Place
- 1104 Garry Lynne Dr
- 4002 Copperwood Ct
- 3907 Copperwood Ct
- 1303 Crest Dr
- 1421 Plantation Dr N
- 1136 Wingate Dr
- 5104 Preservation Ave
- 909 Brestol Ct W
- 37 Piazza Ln
- 628 Huntwich Dr
- 2001 Oak Knoll Dr
- 5200 Preservation Ave
- 4600 Bransford Rd
- 34 Piazza Ln Unit 37
- 1921 Maplewood Trail
- 1201 Somerset Blvd
- 1113 Somerset Blvd
- 1109 Somerset Blvd
- 4500 Dartmoore Ln
- 1108 Somerset Blvd
- 1209 Somerset Blvd
- 1105 Somerset Blvd
- 4504 Dartmoore Ln
- 4501 Dartmoore Ln
- 1213 Somerset Blvd
- 1104 Somerset Blvd
- 1101 Somerset Blvd
- 4508 Dartmoore Ln
- 4500 Alexandra Dr
- 4505 Dartmoore Ln
- 1217 Somerset Blvd
- 4315 Bedford Rd
- 4509 Dartmoore Ln
- 4509 Westbury Dr
- 4504 Alexandra Dr