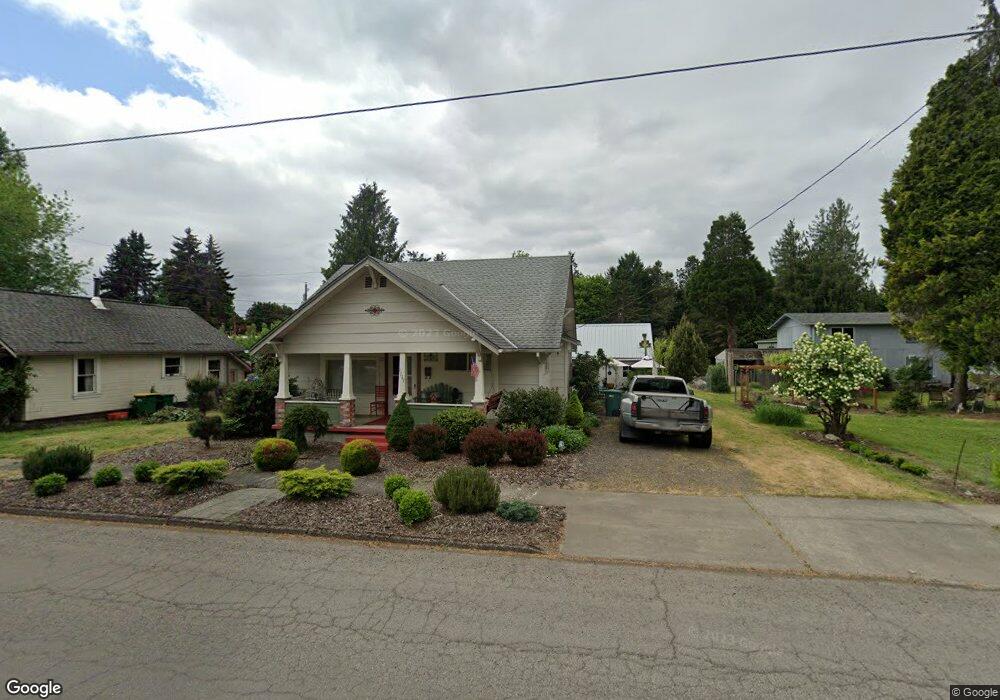
1117 State Ave Vernonia, OR 97064
Estimated Value: $318,000 - $333,000
4
Beds
1
Bath
1,468
Sq Ft
$223/Sq Ft
Est. Value
About This Home
This home is located at 1117 State Ave, Vernonia, OR 97064 and is currently estimated at $327,100, approximately $222 per square foot. 1117 State Ave is a home located in Columbia County with nearby schools including Vernonia High School.
Ownership History
Date
Name
Owned For
Owner Type
Purchase Details
Closed on
Sep 10, 2025
Sold by
Bartee Nancy
Bought by
Nancy Ann Bartee Trust and Bartee
Current Estimated Value
Purchase Details
Closed on
Jan 17, 2014
Sold by
Dewitt Valerie G and Randall Aultman R
Bought by
Bartee Nancy
Home Financials for this Owner
Home Financials are based on the most recent Mortgage that was taken out on this home.
Original Mortgage
$69,440
Interest Rate
4.4%
Mortgage Type
Commercial
Create a Home Valuation Report for This Property
The Home Valuation Report is an in-depth analysis detailing your home's value as well as a comparison with similar homes in the area
Home Values in the Area
Average Home Value in this Area
Purchase History
| Date | Buyer | Sale Price | Title Company |
|---|---|---|---|
| Nancy Ann Bartee Trust | -- | None Listed On Document | |
| Bartee Nancy | $86,800 | Multiple |
Source: Public Records
Mortgage History
| Date | Status | Borrower | Loan Amount |
|---|---|---|---|
| Previous Owner | Bartee Nancy | $69,440 |
Source: Public Records
Tax History Compared to Growth
Tax History
| Year | Tax Paid | Tax Assessment Tax Assessment Total Assessment is a certain percentage of the fair market value that is determined by local assessors to be the total taxable value of land and additions on the property. | Land | Improvement |
|---|---|---|---|---|
| 2024 | $2,180 | $119,340 | $49,380 | $69,960 |
| 2023 | $2,152 | $115,870 | $38,550 | $77,320 |
| 2022 | $2,051 | $112,500 | $37,430 | $75,070 |
| 2021 | $1,993 | $109,230 | $41,170 | $68,060 |
| 2020 | $1,939 | $106,050 | $39,680 | $66,370 |
| 2019 | $1,799 | $102,970 | $38,160 | $64,810 |
| 2018 | $1,776 | $99,980 | $50,510 | $49,470 |
| 2017 | $1,733 | $97,070 | $49,040 | $48,030 |
| 2016 | $1,437 | $84,020 | $41,050 | $42,970 |
| 2015 | $1,343 | $80,810 | $37,940 | $42,870 |
| 2014 | $1,276 | $74,810 | $34,620 | $40,190 |
Source: Public Records
Map
Nearby Homes