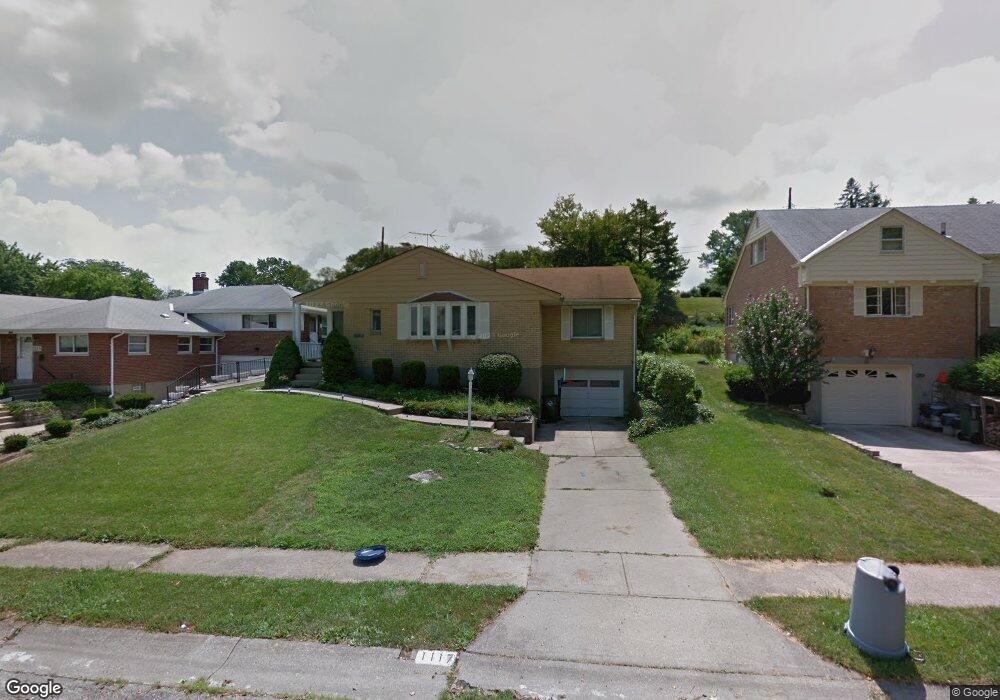
1117 Susan Dr Hamilton, OH 45013
Estimated Value: $222,674 - $252,000
3
Beds
2
Baths
1,460
Sq Ft
$163/Sq Ft
Est. Value
About This Home
This home is located at 1117 Susan Dr, Hamilton, OH 45013 and is currently estimated at $238,169, approximately $163 per square foot. 1117 Susan Dr is a home located in Butler County with nearby schools including Ridgeway Elementary School, Wilson Middle School, and Hamilton High School Main Campus.
Ownership History
Date
Name
Owned For
Owner Type
Purchase Details
Closed on
Mar 15, 2022
Sold by
Ader Dianne J
Bought by
Ader Dianne J
Current Estimated Value
Home Financials for this Owner
Home Financials are based on the most recent Mortgage that was taken out on this home.
Original Mortgage
$110,000
Outstanding Balance
$102,134
Interest Rate
3.85%
Mortgage Type
New Conventional
Estimated Equity
$136,035
Purchase Details
Closed on
Oct 21, 2021
Sold by
Ringel Mark H
Bought by
Ringel Dianne J and Ader Dianne J
Purchase Details
Closed on
Jan 31, 2003
Sold by
Kinkaid Donna A and Kinkaid Dale E
Bought by
Ringel Mark H and Ader Dianne J
Home Financials for this Owner
Home Financials are based on the most recent Mortgage that was taken out on this home.
Original Mortgage
$99,200
Interest Rate
6.13%
Mortgage Type
Purchase Money Mortgage
Purchase Details
Closed on
Sep 28, 1998
Sold by
Kinkaid Dale E
Bought by
Kinkaid Donna A
Purchase Details
Closed on
May 1, 1993
Create a Home Valuation Report for This Property
The Home Valuation Report is an in-depth analysis detailing your home's value as well as a comparison with similar homes in the area
Home Values in the Area
Average Home Value in this Area
Purchase History
| Date | Buyer | Sale Price | Title Company |
|---|---|---|---|
| Ader Dianne J | -- | Richardson Ira A | |
| Ringel Dianne J | -- | None Available | |
| Ringel Mark H | $124,000 | Midland Title Security Inc | |
| Kinkaid Donna A | -- | -- | |
| -- | $80,000 | -- |
Source: Public Records
Mortgage History
| Date | Status | Borrower | Loan Amount |
|---|---|---|---|
| Open | Ader Dianne J | $110,000 | |
| Previous Owner | Ringel Mark H | $99,200 |
Source: Public Records
Tax History
| Year | Tax Paid | Tax Assessment Tax Assessment Total Assessment is a certain percentage of the fair market value that is determined by local assessors to be the total taxable value of land and additions on the property. | Land | Improvement |
|---|---|---|---|---|
| 2025 | $2,308 | $54,870 | $9,150 | $45,720 |
| 2024 | $2,308 | $54,870 | $9,150 | $45,720 |
| 2023 | $2,706 | $54,870 | $9,150 | $45,720 |
| 2022 | $2,405 | $40,160 | $9,150 | $31,010 |
| 2021 | $2,176 | $38,850 | $9,150 | $29,700 |
| 2020 | $2,257 | $38,850 | $9,150 | $29,700 |
| 2019 | $2,640 | $36,060 | $9,710 | $26,350 |
| 2018 | $1,676 | $36,060 | $9,710 | $26,350 |
| 2017 | $1,691 | $36,060 | $9,710 | $26,350 |
| 2016 | $1,650 | $33,540 | $9,710 | $23,830 |
| 2015 | $1,641 | $33,540 | $9,710 | $23,830 |
| 2014 | $1,753 | $33,540 | $9,710 | $23,830 |
| 2013 | $1,753 | $38,140 | $9,710 | $28,430 |
Source: Public Records
Map
Nearby Homes
- 4 Kensington Dr
- 936 Elizabeth Dr
- 974 Westview Ave
- 672 Glenway Dr
- 30 S Washington Blvd
- 42 Ramsey Dr
- 732 Millville Ave
- 540 Carlisle Ave
- 104 Chamberlin Dr
- 236 Fairborn Dr
- 1326 Franklin St
- 238 Twinbrook Dr
- 1475 Diana Dr
- 751 Springvale Dr
- 346 Hyde Park Dr
- 824 Carlisle Ave
- 1044 Hunt Ave
- 75 Berkshire Ct
- 30 Berkshire Ct
- 925 Carlisle Ave
Your Personal Tour Guide
Ask me questions while you tour the home.