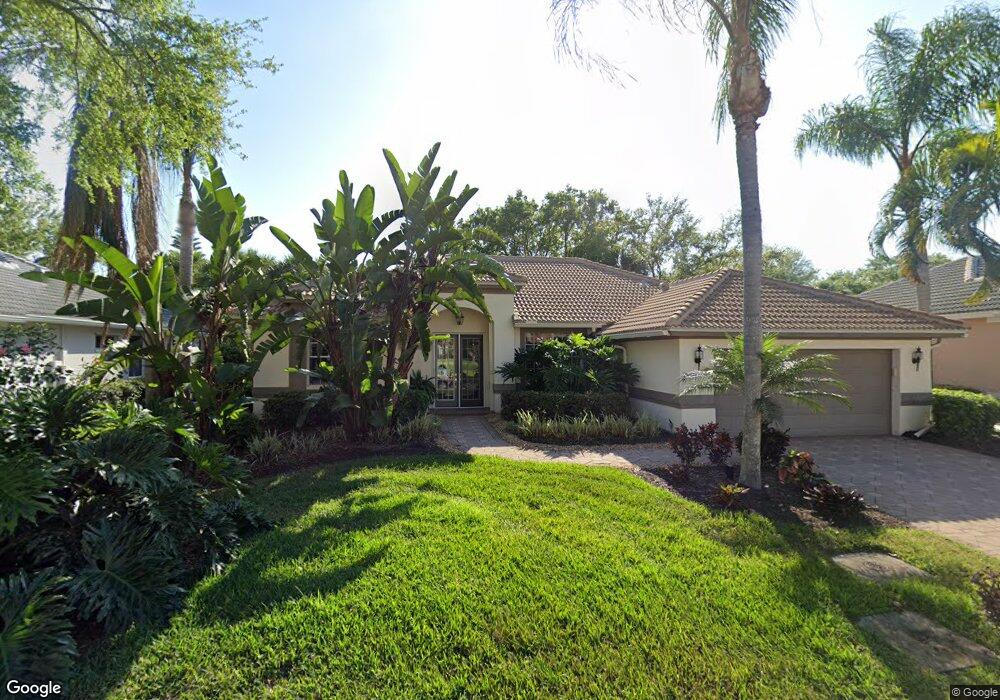
11176 Callaway Greens Dr Fort Myers, FL 33913
Gateway NeighborhoodEstimated Value: $455,429 - $572,000
3
Beds
2
Baths
2,141
Sq Ft
$232/Sq Ft
Est. Value
About This Home
This home is located at 11176 Callaway Greens Dr, Fort Myers, FL 33913 and is currently estimated at $495,857, approximately $231 per square foot. 11176 Callaway Greens Dr is a home located in Lee County with nearby schools including Gateway Elementary School, Tice Elementary School, and Orange River Elementary School.
Ownership History
Date
Name
Owned For
Owner Type
Purchase Details
Closed on
Feb 14, 2013
Sold by
Kalusing Ronald J
Bought by
Gallina Fred S
Current Estimated Value
Purchase Details
Closed on
Oct 12, 2009
Sold by
Osterhoudt Betty and Osterhoudt Betty L
Bought by
Klausing Ronald J and Ronald J Klausing Revocable Trust
Purchase Details
Closed on
Sep 21, 2009
Sold by
Tuchman Hy
Bought by
Osterhoudt Betty
Purchase Details
Closed on
Sep 18, 2009
Sold by
Tuchman Hy
Bought by
Osterhoudt Betty
Purchase Details
Closed on
Feb 16, 2005
Sold by
Osterhoudt Betty and Tuchman Hy
Bought by
Osterhoudt Betty and Tuchman Hy
Purchase Details
Closed on
Dec 1, 2004
Sold by
Marking Anthony
Bought by
Osterhoudt Betty and Tuchman Hy
Purchase Details
Closed on
Dec 16, 1998
Sold by
Bay Colony Gateway Inc
Bought by
Marking Anthony E
Create a Home Valuation Report for This Property
The Home Valuation Report is an in-depth analysis detailing your home's value as well as a comparison with similar homes in the area
Home Values in the Area
Average Home Value in this Area
Purchase History
| Date | Buyer | Sale Price | Title Company |
|---|---|---|---|
| Gallina Fred S | $230,000 | Security Title & Abstract Ll | |
| Klausing Ronald J | $195,000 | Winged Foot Title Llc | |
| Osterhoudt Betty | -- | Attorney | |
| Osterhoudt Betty | -- | Attorney | |
| Osterhoudt Betty | -- | -- | |
| Osterhoudt Betty | $273,000 | Title Group Of Fort Myers Lt | |
| Marking Anthony E | -- | -- |
Source: Public Records
Tax History Compared to Growth
Tax History
| Year | Tax Paid | Tax Assessment Tax Assessment Total Assessment is a certain percentage of the fair market value that is determined by local assessors to be the total taxable value of land and additions on the property. | Land | Improvement |
|---|---|---|---|---|
| 2025 | $6,495 | $400,600 | $80,750 | $295,896 |
| 2024 | $6,848 | $430,583 | $112,033 | $292,126 |
| 2023 | $6,848 | $411,076 | $108,347 | $287,358 |
| 2022 | $3,912 | $234,157 | $0 | $0 |
| 2021 | $3,797 | $235,178 | $76,608 | $158,570 |
| 2020 | $3,820 | $224,677 | $0 | $0 |
| 2019 | $3,642 | $219,626 | $74,498 | $145,128 |
| 2018 | $3,715 | $222,870 | $74,498 | $148,372 |
| 2017 | $3,690 | $222,216 | $0 | $0 |
| 2016 | $3,584 | $217,645 | $72,450 | $145,195 |
| 2015 | $3,765 | $198,191 | $69,300 | $128,891 |
| 2014 | -- | $198,806 | $60,000 | $138,806 |
| 2013 | -- | $186,498 | $40,000 | $146,498 |
Source: Public Records
Map
Nearby Homes
- 11195 Callaway Greens Dr
- 11146 Callaway Greens Dr
- 11229 Callaway Greens Dr
- 11268 Callaway Greens Dr
- 11550 Shady Palm Way
- 11395 Shady Blossom Dr
- 10951 Callaway Greens Ct
- 12022 Mahogany Isle Ln
- 11546 Onyx Cir
- 11498 Tiverton Trace
- 12020 Champions Green Way Unit 112
- 12051 Champions Green Way Unit 322
- 11574 Onyx Cir
- 12031 Sabal Dunes Ln
- 10879 Pond Ridge Dr
- 12100 Sabal Dunes Ln
- 11581 Golden Oak Terrace
- 12071 Sabal Lakes Ln
- 11605 Golden Oak Terrace
- 11289 Thurston Chase
- 11170 Callaway Greens Dr
- 11182 Callaway Greens Dr
- 11164 Callaway Greens Dr
- 11188 Callaway Greens Dr
- 11175 Callaway Greens Dr
- 11183 Callaway Greens Dr
- 11165 Callaway Greens Dr
- 11158 Callaway Greens Dr
- 11194 Callaway Greens Dr
- 11159 Callaway Greens Dr
- 11152 Callaway Greens Dr
- 11153 Callaway Greens Dr
- 11200 Callaway Greens Dr
- 11201 Callaway Greens Dr
- 11145 Callaway Greens Dr
- 11206 Callaway Greens Dr
- 11213 Callaway Greens Dr
- 11212 Callaway Greens Dr
- 11140 Callaway Greens Dr
- 11140 Callaway Greens Dr