
Seller's Agent in 2024
Jeffrey Wehr
Ruhl&Ruhl REALTORS Bettendorf
(563) 320-2298
4 in this area
212 Total Sales

Estimated Value: $194,908 - $307,000
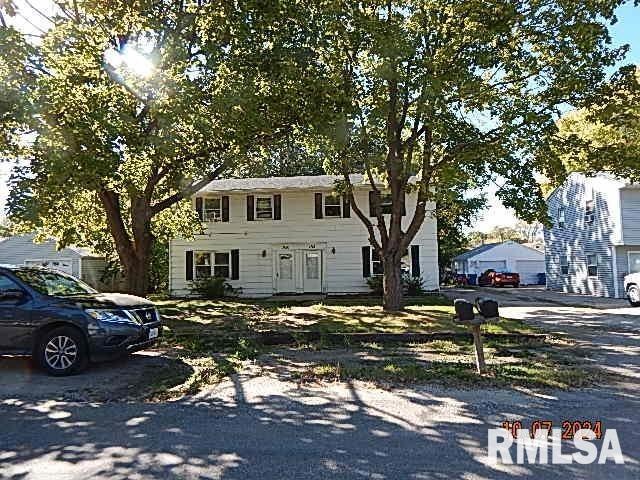
Great Duplex- 3-bedroom units, both currently rented. All Separate utilities including water! 1120 Unit has bonus room on back with extra bath, fireplace. Solid surface counters. Each unit has detached 1-car garage,
Last Agent to Sell the Property
Ruhl&Ruhl REALTORS Bettendorf Brokerage Phone: 563-441-1776 License #S35594000/475.143448 Listed on: 10/09/2024
| Date | Buyer | Sale Price | Title Company |
|---|---|---|---|
| Rosales Rodolfo Patino | -- | Gomez Title | |
| Rosales Rodolfo Patino | -- | Gomez Title | |
| Rk Development Lc Series 14 | $115,000 | Gomez Title | |
| Rk Development Lc Series 14 | -- | Gomez Title |
| Date | Status | Borrower | Loan Amount |
|---|---|---|---|
| Open | Rosales Rodolfo Patino | $108,000 | |
| Closed | Rosales Rodolfo Patino | $108,000 | |
| Previous Owner | Rk Development Lc Series 14 | $103,600 |
| Date | Event | Price | List to Sale | Price per Sq Ft |
|---|---|---|---|---|
| 11/26/2024 11/26/24 | Sold | $270,000 | +86.2% | $104 / Sq Ft |
| 10/28/2024 10/28/24 | Pending | -- | -- | -- |
| 10/09/2024 10/09/24 | For Sale | $145,000 | -- | $56 / Sq Ft |
| Year | Tax Paid | Tax Assessment Tax Assessment Total Assessment is a certain percentage of the fair market value that is determined by local assessors to be the total taxable value of land and additions on the property. | Land | Improvement |
|---|---|---|---|---|
| 2024 | $4,653 | $47,839 | $4,182 | $43,657 |
| 2023 | $4,653 | $46,625 | $4,075 | $42,550 |
| 2022 | $4,526 | $45,355 | $3,964 | $41,391 |
| 2021 | $4,446 | $43,361 | $3,790 | $39,571 |
| 2020 | $4,416 | $42,804 | $3,741 | $39,063 |
| 2019 | $4,369 | $42,026 | $3,673 | $38,353 |
| 2018 | $4,320 | $42,026 | $3,673 | $38,353 |
| 2017 | $4,210 | $41,243 | $3,605 | $37,638 |
| 2016 | $4,198 | $41,038 | $3,587 | $37,451 |
| 2015 | $4,127 | $40,234 | $3,517 | $36,717 |
| 2014 | $941 | $39,226 | $3,429 | $35,797 |
| 2013 | $941 | $39,226 | $3,429 | $35,797 |
Seller's Agent in 2024
Jeffrey Wehr
Ruhl&Ruhl REALTORS Bettendorf
(563) 320-2298
4 in this area
212 Total Sales
Buyer's Agent in 2024
Heidi Colbrese
Ruhl&Ruhl REALTORS Moline
(309) 373-2549
9 in this area
173 Total Sales
Source: RMLS Alliance
MLS Number: QC4257297
APN: 18-05-107-008
Disclaimer: Certain information contained herein is derived from information provided by parties other than Homes.com. All information provided is deemed reliable, but is not guaranteed to be accurate and should be independently verified.
![]() Based on information submitted to the MLS GRID. All data is obtained from various sources and may not have been verified by broker or MLS GRID. Supplied Open House Information is subject to change without notice. All information should be independently reviewed and verified for accuracy. Properties may or may not be listed by the office/agent presenting the information. Some IDX listings have been excluded from this website.IDX information is provided exclusively for personal, non-commercial use, and may not be used for any purpose other than to identify prospective properties consumers may be interested in purchasing. Information is deemed reliable but not guaranteed.
Based on information submitted to the MLS GRID. All data is obtained from various sources and may not have been verified by broker or MLS GRID. Supplied Open House Information is subject to change without notice. All information should be independently reviewed and verified for accuracy. Properties may or may not be listed by the office/agent presenting the information. Some IDX listings have been excluded from this website.IDX information is provided exclusively for personal, non-commercial use, and may not be used for any purpose other than to identify prospective properties consumers may be interested in purchasing. Information is deemed reliable but not guaranteed.
Based on information submitted to the MLS GRID
Ask me questions while you tour the home.