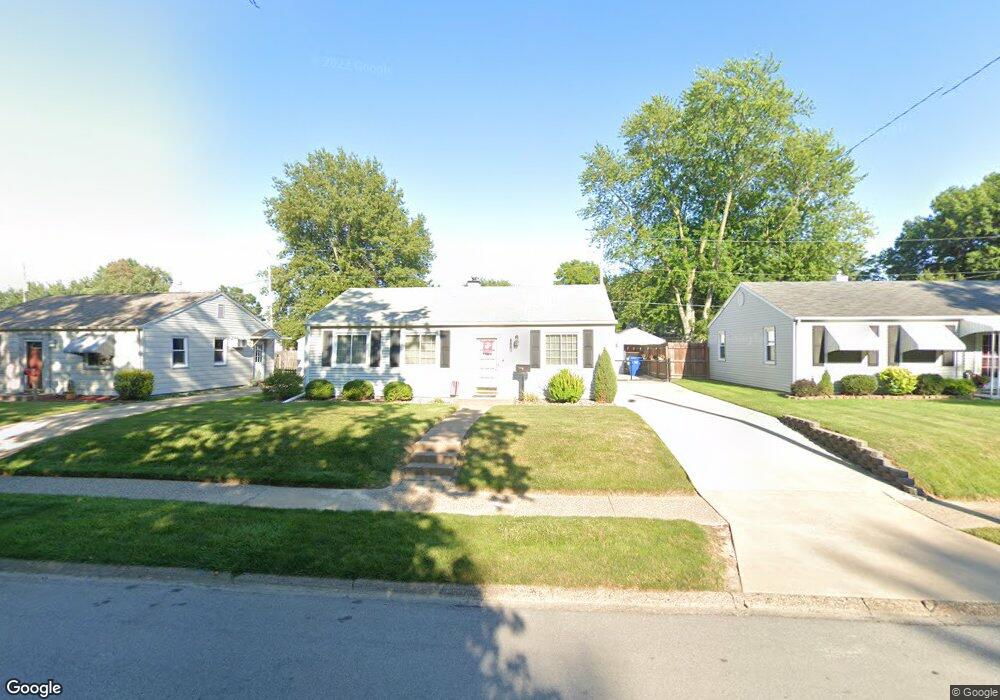
1118 39th St Moline, IL 61265
Estimated Value: $103,000 - $130,000
3
Beds
1
Bath
936
Sq Ft
$121/Sq Ft
Est. Value
About This Home
This home is located at 1118 39th St, Moline, IL 61265 and is currently estimated at $112,939, approximately $120 per square foot. 1118 39th St is a home located in Rock Island County with nearby schools including George Washington Elementary School, Woodrow Wilson Middle School, and Moline Sr High School.
Ownership History
Date
Name
Owned For
Owner Type
Purchase Details
Closed on
Sep 1, 2023
Sold by
Heald Stephen D
Bought by
Wolf Gregory R
Current Estimated Value
Home Financials for this Owner
Home Financials are based on the most recent Mortgage that was taken out on this home.
Original Mortgage
$69,000
Outstanding Balance
$67,478
Interest Rate
6.75%
Mortgage Type
New Conventional
Estimated Equity
$45,461
Purchase Details
Closed on
Jul 2, 2021
Sold by
Heald Stephen D
Bought by
Heald Stephen D
Create a Home Valuation Report for This Property
The Home Valuation Report is an in-depth analysis detailing your home's value as well as a comparison with similar homes in the area
Home Values in the Area
Average Home Value in this Area
Purchase History
| Date | Buyer | Sale Price | Title Company |
|---|---|---|---|
| Wolf Gregory R | $92,000 | Gomez Title | |
| Heald Stephen D | -- | Califf & Harper Pc |
Source: Public Records
Mortgage History
| Date | Status | Borrower | Loan Amount |
|---|---|---|---|
| Open | Wolf Gregory R | $69,000 |
Source: Public Records
Tax History
| Year | Tax Paid | Tax Assessment Tax Assessment Total Assessment is a certain percentage of the fair market value that is determined by local assessors to be the total taxable value of land and additions on the property. | Land | Improvement |
|---|---|---|---|---|
| 2024 | $3,044 | $34,904 | $8,106 | $26,798 |
| 2023 | $3,044 | $32,140 | $7,464 | $24,676 |
| 2022 | $2,038 | $28,701 | $7,001 | $21,700 |
| 2021 | $2,006 | $27,439 | $6,693 | $20,746 |
| 2020 | $199 | $26,980 | $6,581 | $20,399 |
| 2019 | $1,960 | $26,555 | $6,477 | $20,078 |
| 2018 | $1,849 | $25,612 | $6,380 | $19,232 |
| 2017 | $1,809 | $25,209 | $6,280 | $18,929 |
| 2016 | $1,746 | $24,427 | $6,085 | $18,342 |
| 2015 | $1,693 | $23,873 | $5,947 | $17,926 |
| 2014 | $419 | $24,111 | $6,006 | $18,105 |
| 2013 | $419 | $24,111 | $6,006 | $18,105 |
Source: Public Records
Map
Nearby Homes
- 1144 39th St
- 3602 14th Ave
- 4200 13th Ave
- 968 40th St
- 4204 13th Ave
- 3618 15th Avenue Ct
- 4216 13th Ave
- 1501 43rd St
- 1039 33rd Street Ct
- 3610 19th Ave
- 1700 46th St
- 3116 11th Ave Unit C
- 1917 33rd St
- 3316 Avenue of the Cities
- 411 39th St
- 2748 11th Avenue C
- 4810 21st Ave Unit A
- 1916 31st Street A
- 1930 31st Street A
- 408 43rd St
Your Personal Tour Guide
Ask me questions while you tour the home.