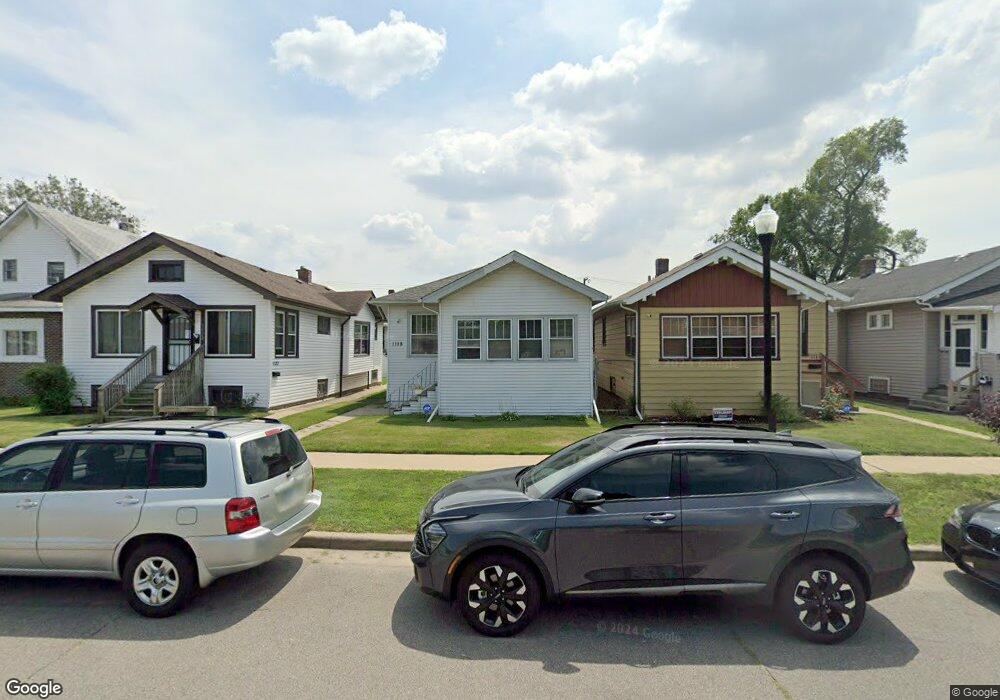
1118 Becker St Hammond, IN 46320
Estimated Value: $68,000 - $139,000
3
Beds
1
Bath
864
Sq Ft
$125/Sq Ft
Est. Value
About This Home
This home is located at 1118 Becker St, Hammond, IN 46320 and is currently estimated at $107,625, approximately $124 per square foot. 1118 Becker St is a home located in Lake County with nearby schools including Maywood Elementary School, Eggers Middle School, and Hammond High School.
Ownership History
Date
Name
Owned For
Owner Type
Purchase Details
Closed on
Aug 26, 2022
Sold by
David Epperson Mark
Bought by
Epperson Mark David and Toliver Pamela Marie
Current Estimated Value
Home Financials for this Owner
Home Financials are based on the most recent Mortgage that was taken out on this home.
Original Mortgage
$48,500
Outstanding Balance
$46,191
Interest Rate
5.54%
Mortgage Type
New Conventional
Estimated Equity
$61,434
Purchase Details
Closed on
Aug 13, 2019
Sold by
Owens Krista and Myers Kevin
Bought by
Myers Karen S
Purchase Details
Closed on
Apr 10, 2006
Sold by
Feuerbach Elizabeth Zamarron and De Dios Margaret Uneeda
Bought by
Myers Jerry A
Home Financials for this Owner
Home Financials are based on the most recent Mortgage that was taken out on this home.
Original Mortgage
$51,200
Interest Rate
6.34%
Mortgage Type
Fannie Mae Freddie Mac
Create a Home Valuation Report for This Property
The Home Valuation Report is an in-depth analysis detailing your home's value as well as a comparison with similar homes in the area
Home Values in the Area
Average Home Value in this Area
Purchase History
| Date | Buyer | Sale Price | Title Company |
|---|---|---|---|
| Epperson Mark David | -- | -- | |
| Epperson Mark David | -- | Meridian Title | |
| Myers Karen S | -- | None Available | |
| Myers Karen S | -- | None Available | |
| Myers Karen S | -- | None Available | |
| Myers Jerry A | -- | Community Title Company |
Source: Public Records
Mortgage History
| Date | Status | Borrower | Loan Amount |
|---|---|---|---|
| Open | Epperson Mark David | $48,500 | |
| Closed | Epperson Mark David | $48,500 | |
| Previous Owner | Myers Jerry A | $51,200 |
Source: Public Records
Tax History
| Year | Tax Paid | Tax Assessment Tax Assessment Total Assessment is a certain percentage of the fair market value that is determined by local assessors to be the total taxable value of land and additions on the property. | Land | Improvement |
|---|---|---|---|---|
| 2025 | $914 | $99,000 | $17,800 | $81,200 |
| 2024 | $3,891 | $89,400 | $17,800 | $71,600 |
| 2023 | $738 | $81,400 | $19,100 | $62,300 |
| 2022 | $738 | $76,900 | $19,100 | $57,800 |
| 2021 | $1,540 | $56,800 | $6,400 | $50,400 |
| 2020 | $1,294 | $47,400 | $6,400 | $41,000 |
| 2019 | $1,280 | $42,900 | $6,400 | $36,500 |
| 2018 | $1,322 | $41,200 | $6,400 | $34,800 |
| 2017 | $1,485 | $40,500 | $6,400 | $34,100 |
| 2016 | $1,338 | $42,200 | $6,400 | $35,800 |
| 2014 | $1,385 | $44,200 | $6,400 | $37,800 |
| 2013 | $1,257 | $42,400 | $6,400 | $36,000 |
Source: Public Records
Map
Nearby Homes
- 5901 Columbia Ave
- 1137 Lyons St
- 5856 Wallace Rd
- 1128 Highland St
- 1119 Sibley St
- 830 Becker St
- 1360 Sherman St
- 924 Highland St
- 922 Summer St
- 920 Highland St
- 5631 Alice St
- 5411 Columbia Ave
- 904 Field St
- 1507 Summer St
- 1111 Truman St
- 5941 Birch Ave
- 1016 Ames St
- 5545 Claude Ave
- 911 Conkey St
- 909 Conkey St
Your Personal Tour Guide
Ask me questions while you tour the home.