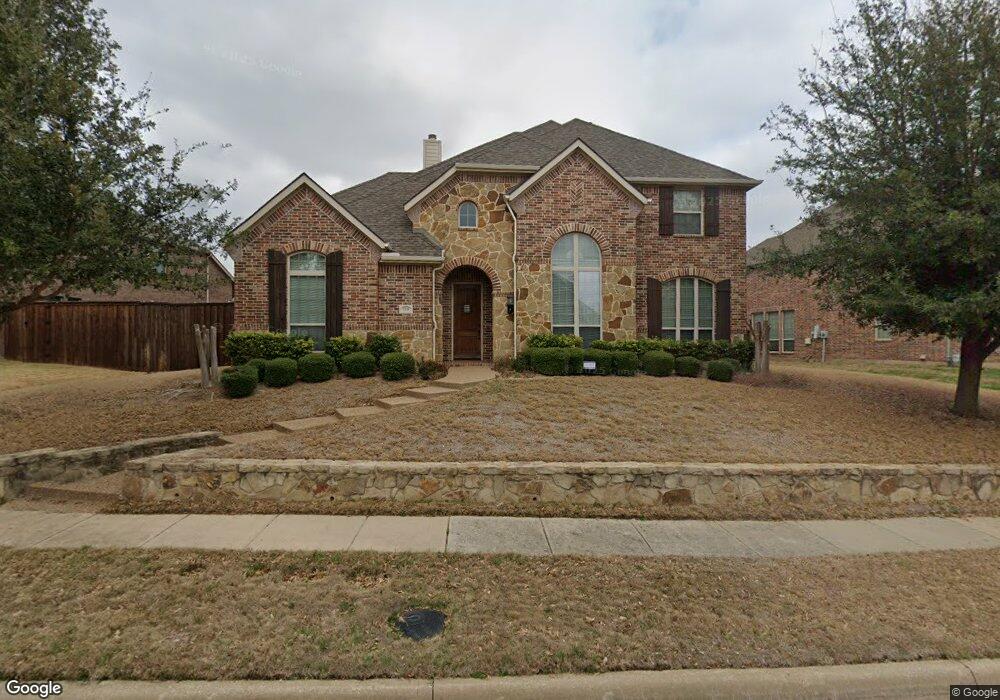
1118 Billie Johnson Ln Garland, TX 75044
Firewheel NeighborhoodEstimated Value: $684,118 - $743,000
5
Beds
4
Baths
4,103
Sq Ft
$172/Sq Ft
Est. Value
About This Home
This home is located at 1118 Billie Johnson Ln, Garland, TX 75044 and is currently estimated at $705,030, approximately $171 per square foot. 1118 Billie Johnson Ln is a home located in Dallas County with nearby schools including Oakhill Day School and Firewheel Christian Academy.
Ownership History
Date
Name
Owned For
Owner Type
Purchase Details
Closed on
Nov 6, 2012
Sold by
Butler John and Tran Lan Anh
Bought by
Fulce Mitchel L and Fulce Laura A
Current Estimated Value
Home Financials for this Owner
Home Financials are based on the most recent Mortgage that was taken out on this home.
Original Mortgage
$258,000
Outstanding Balance
$178,367
Interest Rate
3.4%
Mortgage Type
New Conventional
Estimated Equity
$526,663
Purchase Details
Closed on
Oct 23, 2009
Sold by
Highland Homes Ltd
Bought by
Butler John and Tran Lan Anh
Home Financials for this Owner
Home Financials are based on the most recent Mortgage that was taken out on this home.
Original Mortgage
$288,000
Interest Rate
5.03%
Mortgage Type
New Conventional
Purchase Details
Closed on
Dec 5, 2008
Sold by
Provence At Firewheel Lp
Bought by
Highland Homes Ltd
Create a Home Valuation Report for This Property
The Home Valuation Report is an in-depth analysis detailing your home's value as well as a comparison with similar homes in the area
Home Values in the Area
Average Home Value in this Area
Purchase History
| Date | Buyer | Sale Price | Title Company |
|---|---|---|---|
| Fulce Mitchel L | -- | Rtt | |
| Butler John | -- | None Available | |
| Highland Homes Ltd | -- | Rtc |
Source: Public Records
Mortgage History
| Date | Status | Borrower | Loan Amount |
|---|---|---|---|
| Open | Fulce Mitchel L | $258,000 | |
| Previous Owner | Butler John | $288,000 |
Source: Public Records
Tax History Compared to Growth
Tax History
| Year | Tax Paid | Tax Assessment Tax Assessment Total Assessment is a certain percentage of the fair market value that is determined by local assessors to be the total taxable value of land and additions on the property. | Land | Improvement |
|---|---|---|---|---|
| 2025 | $11,332 | $659,790 | $95,000 | $564,790 |
| 2024 | $11,332 | $659,790 | $95,000 | $564,790 |
| 2023 | $11,332 | $659,790 | $95,000 | $564,790 |
| 2022 | $14,211 | $577,940 | $95,000 | $482,940 |
| 2021 | $11,660 | $443,410 | $95,000 | $348,410 |
| 2020 | $11,820 | $443,410 | $95,000 | $348,410 |
| 2019 | $12,509 | $443,410 | $95,000 | $348,410 |
| 2018 | $11,420 | $404,760 | $80,000 | $324,760 |
| 2017 | $11,411 | $404,760 | $80,000 | $324,760 |
| 2016 | $11,411 | $404,760 | $80,000 | $324,760 |
| 2015 | $8,587 | $360,720 | $54,000 | $306,720 |
| 2014 | $8,587 | $360,720 | $54,000 | $306,720 |
Source: Public Records
Map
Nearby Homes
- 1313 Bobby Boyd Ln
- 1214 Luna Ln
- 1205 Luna Ln
- 5100 Murphy Rd
- 5302 Murphy Rd
- 5205 Jefferson Dr
- 5007 Jefferson Dr
- 1641 Ben Davis Rd
- TBS Hwy78
- 4802 Walton Heath Dr
- 5117 Greensboro Dr
- 5401 Sawgrass Ct
- 2006 Cornwall Ln
- 2402 Ash Ln
- 2406 Bent Oak Trail
- 2414 Ash Ln
- 2402 Bent Oak Trail
- 2418 Ash Ln
- 2422 Ash Ln
- 1230 Donegal Ln
- 1206 Billie Johnson Ln
- 1110 Billie Johnson Ln
- 1210 Billie Johnson Ln
- 1117 Billie Johnson Ln
- 1201 Billie Johnson Ln
- 1117 Burnett Ct
- 1102 Wynne Dr
- 1113 Billie Johnson Ln
- 1205 Billie Johnson Ln
- 1109 Billie Johnson Ln
- 1113 Burnett Ct
- 1106 Wynne Dr
- 1102 Billie Johnson Ln
- 1209 Billie Johnson Ln
- 1105 Billie Johnson Ln
- 1110 Wynne Dr
- 1213 Billie Johnson Ln
- 1302 Billie Johnson Ln
- 1101 Billie Johnson Ln
- 1202 Kent Brown Rd