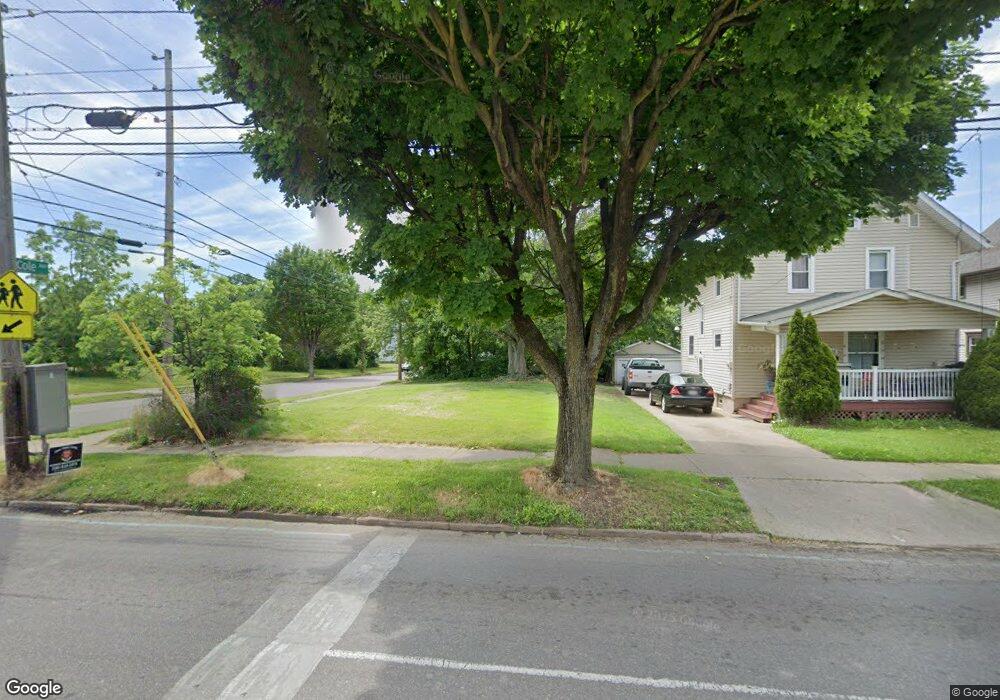
1118 Brown St Akron, OH 44301
South Akron NeighborhoodEstimated Value: $77,000 - $98,000
4
Beds
2
Baths
1,210
Sq Ft
$74/Sq Ft
Est. Value
About This Home
This home is located at 1118 Brown St, Akron, OH 44301 and is currently estimated at $89,000, approximately $73 per square foot. 1118 Brown St is a home located in Summit County with nearby schools including McEbright Elementary School, Kenmore Garfield Community Learning Center, and Main Preparatory Academy.
Ownership History
Date
Name
Owned For
Owner Type
Purchase Details
Closed on
May 21, 2008
Sold by
Maynard Raymond A and Maynard Dolores
Bought by
Maynley Investments Inc
Current Estimated Value
Purchase Details
Closed on
Aug 11, 2005
Sold by
Third Fsla Of Cleveland
Bought by
Maynard Raymond A
Home Financials for this Owner
Home Financials are based on the most recent Mortgage that was taken out on this home.
Original Mortgage
$43,200
Interest Rate
5.69%
Mortgage Type
Seller Take Back
Purchase Details
Closed on
Apr 26, 2005
Sold by
Fannie Mae
Bought by
Third Fsla Of Cleveland
Purchase Details
Closed on
Nov 15, 2004
Sold by
Tarbis Lisa E
Bought by
Fanniemae and Federal National Mortgage Association
Purchase Details
Closed on
Jul 31, 1995
Sold by
Hoffman Daniel J
Bought by
Tarbis Lisa E and Forsythe Jeffery N
Home Financials for this Owner
Home Financials are based on the most recent Mortgage that was taken out on this home.
Original Mortgage
$55,100
Interest Rate
7.59%
Mortgage Type
New Conventional
Create a Home Valuation Report for This Property
The Home Valuation Report is an in-depth analysis detailing your home's value as well as a comparison with similar homes in the area
Home Values in the Area
Average Home Value in this Area
Purchase History
| Date | Buyer | Sale Price | Title Company |
|---|---|---|---|
| Maynley Investments Inc | -- | Portage Title Agency Inc | |
| Maynard Raymond A | $48,000 | Third Capital | |
| Third Fsla Of Cleveland | $40,000 | Ohio Title Corp | |
| Fanniemae | $40,000 | -- | |
| Tarbis Lisa E | $58,000 | -- |
Source: Public Records
Mortgage History
| Date | Status | Borrower | Loan Amount |
|---|---|---|---|
| Previous Owner | Maynard Raymond A | $43,200 | |
| Previous Owner | Tarbis Lisa E | $55,100 |
Source: Public Records
Tax History Compared to Growth
Tax History
| Year | Tax Paid | Tax Assessment Tax Assessment Total Assessment is a certain percentage of the fair market value that is determined by local assessors to be the total taxable value of land and additions on the property. | Land | Improvement |
|---|---|---|---|---|
| 2025 | $61,741 | $4,771 | $4,771 | -- |
| 2024 | $2,449 | $4,771 | $4,771 | -- |
| 2023 | $1,610 | $4,771 | $4,771 | -- |
| 2022 | $1,610 | $3,077 | $3,077 | $0 |
| 2021 | $2,588 | $3,077 | $3,077 | $0 |
| 2020 | $3,095 | $3,080 | $3,080 | $0 |
| 2019 | $2,626 | $5,820 | $5,820 | $0 |
| 2018 | $2,309 | $5,820 | $5,820 | $0 |
| 2017 | $2,157 | $5,820 | $5,820 | $0 |
| 2016 | $2,157 | $5,820 | $5,820 | $0 |
| 2015 | $2,157 | $5,820 | $5,820 | $0 |
| 2014 | $2,352 | $5,820 | $5,820 | $0 |
| 2013 | $2,769 | $9,160 | $5,820 | $3,340 |
Source: Public Records
Map
Nearby Homes
- 1102 Dietz Ave
- 1094 Dietz Ave
- 568 Stanton Ave
- 1051 Brown St
- 565 Eva Ave
- 1217 Brown St
- 450 Stanton Ave
- 1218 Dietz Ave
- 1100 Beardsley St
- 1230 Herberich Ave
- 1239 Lily St
- 397 Cole Ave
- 1198 Burkhardt Ave
- 979 Neptune Ave
- 1243 Herberich Ave
- 1012 Kling St
- 1264 Dietz Ave
- 1203 Atwood Ave
- 1236 Wilbur Ave
- 1258 Lily St