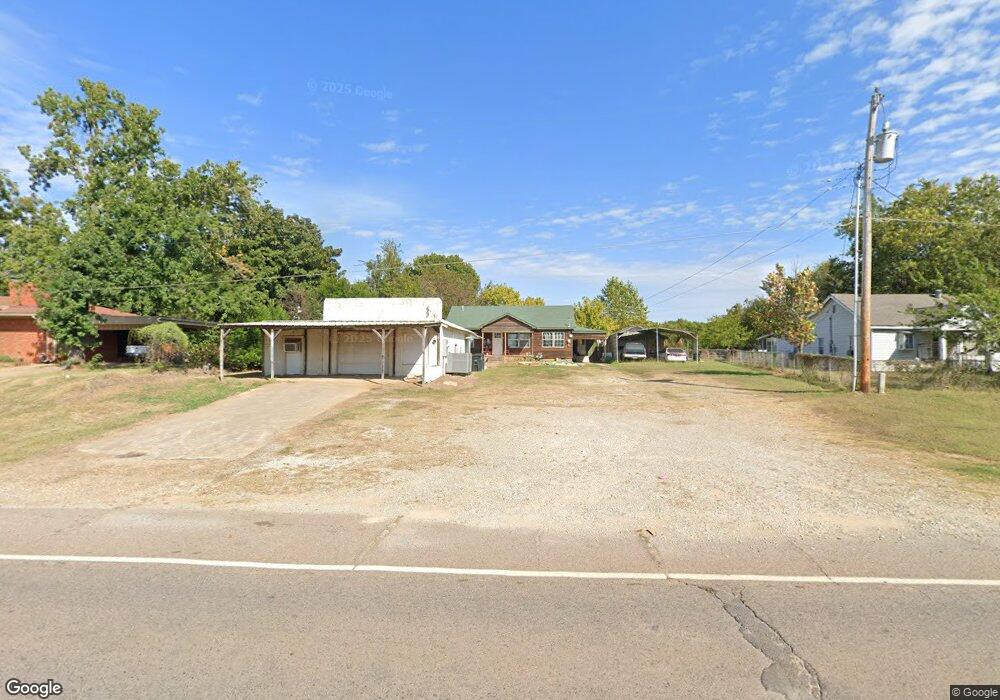
1118 Business 70 Durant, OK 74701
Estimated Value: $56,000 - $156,000
3
Beds
1
Bath
1,220
Sq Ft
$93/Sq Ft
Est. Value
About This Home
This home is located at 1118 Business 70, Durant, OK 74701 and is currently estimated at $113,500, approximately $93 per square foot. 1118 Business 70 is a home located in Bryan County with nearby schools including Washington Irving Elementary School, Durant Middle School, and Durant Intermediate Elementary School.
Ownership History
Date
Name
Owned For
Owner Type
Purchase Details
Closed on
Dec 18, 2024
Sold by
Rapier Casey and Rapier Leigh
Bought by
Cantrell & Cantrell Investments Llc
Current Estimated Value
Purchase Details
Closed on
Apr 4, 2022
Sold by
Rapier and Leigh
Bought by
Ronald Dean Starnes Properties Llc
Purchase Details
Closed on
Sep 19, 2013
Sold by
Ashely Philip N and Ashely Jamie L
Bought by
Rapier Casey and Rapier Leigh
Purchase Details
Closed on
Aug 6, 2012
Sold by
T3 Asset Llc
Bought by
Ashley Philip N and Ashley Jamie L
Home Financials for this Owner
Home Financials are based on the most recent Mortgage that was taken out on this home.
Original Mortgage
$33,016
Interest Rate
3.68%
Mortgage Type
New Conventional
Purchase Details
Closed on
Oct 1, 2010
Sold by
T3 Asset Llc
Bought by
T3 Asset Llc
Purchase Details
Closed on
Mar 21, 1994
Sold by
Messer Florence
Bought by
Messer, Florence Trust
Create a Home Valuation Report for This Property
The Home Valuation Report is an in-depth analysis detailing your home's value as well as a comparison with similar homes in the area
Home Values in the Area
Average Home Value in this Area
Purchase History
| Date | Buyer | Sale Price | Title Company |
|---|---|---|---|
| Cantrell & Cantrell Investments Llc | $55,000 | American Eagle Title | |
| Ronald Dean Starnes Properties Llc | $49,000 | None Listed On Document | |
| Rapier Casey | $38,500 | None Available | |
| Ashley Philip N | $32,500 | None Available | |
| T3 Asset Llc | $254 | None Available | |
| Messer, Florence Trust | -- | -- |
Source: Public Records
Mortgage History
| Date | Status | Borrower | Loan Amount |
|---|---|---|---|
| Previous Owner | Ashley Philip N | $33,016 |
Source: Public Records
Tax History Compared to Growth
Tax History
| Year | Tax Paid | Tax Assessment Tax Assessment Total Assessment is a certain percentage of the fair market value that is determined by local assessors to be the total taxable value of land and additions on the property. | Land | Improvement |
|---|---|---|---|---|
| 2025 | $208 | $2,200 | $2,200 | $0 |
| 2024 | $549 | $5,638 | $2,346 | $3,292 |
| 2023 | $549 | $5,370 | $2,248 | $3,122 |
| 2022 | $480 | $5,114 | $2,103 | $3,011 |
| 2021 | $5 | $4,871 | $1,965 | $2,906 |
| 2020 | $445 | $4,638 | $1,833 | $2,805 |
| 2019 | $400 | $4,417 | $1,708 | $2,709 |
| 2018 | $378 | $4,207 | $1,692 | $2,515 |
| 2017 | $358 | $4,007 | $845 | $3,162 |
| 2016 | $344 | $3,817 | $655 | $3,162 |
| 2015 | $380 | $4,235 | $880 | $3,355 |
| 2014 | $380 | $4,235 | $880 | $3,355 |
Source: Public Records
Map
Nearby Homes
- 1702 Smith St
- 0 N Mclean Rd Unit 2543532
- 68 Loyal Ln
- 501 Lee Ave
- 78 Loyal Ln
- 1202 Parkland Dr
- 145 Loyal Ln
- 1001 Parkland Dr
- 353 Worth Ave
- 515 NE 5th Ave
- 507 NE 5th Ave
- 404 NE 5th Ave
- 131 S Mclean Dr
- 125 S Mclean Dr
- 803 E Florida St
- 324 E Cedar St
- 1503 Hillcrest Ave
- 2551 U S 70
- 000 E Arkansas St
- 223 SE 3rd Ave
- 1120 E Highway 70
- 1114 Business 70
- 1202 E Highway 70
- 1106 U S 70
- 1102 E Highway 70
- 1206 E Highway 70
- 1024 Business 70
- 1220 Business 70
- 1002 Timberline Dr
- 504 W Evergreen St
- 1207 Business 70
- 1102 Timberline Dr
- 1402 E Highway 70
- 1003 Timberline Dr
- 1001 Timberline Dr
- 1104 Timberline Dr
- 1101 Timberline Dr
- 91 N Mclean Rd
- 1401 Business 70
- 113 Timberline Dr