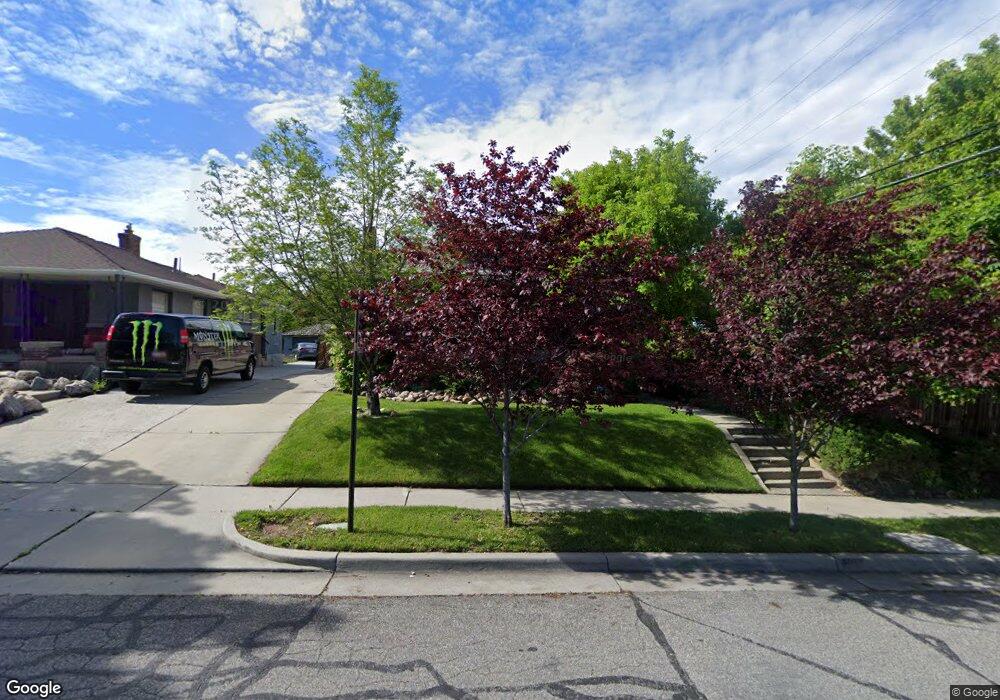
1118 E Garfield Ave Salt Lake City, UT 84105
Sugar House NeighborhoodEstimated Value: $705,000 - $784,000
3
Beds
2
Baths
2,217
Sq Ft
$334/Sq Ft
Est. Value
About This Home
This home is located at 1118 E Garfield Ave, Salt Lake City, UT 84105 and is currently estimated at $741,513, approximately $334 per square foot. 1118 E Garfield Ave is a home located in Salt Lake County with nearby schools including Hawthorne Elementary School, Emerson School, and Clayton Middle School.
Ownership History
Date
Name
Owned For
Owner Type
Purchase Details
Closed on
Jan 9, 2009
Sold by
Delicino Jeremy M and Delicino Jeremiah M
Bought by
Delicino Jeremiah M
Current Estimated Value
Home Financials for this Owner
Home Financials are based on the most recent Mortgage that was taken out on this home.
Original Mortgage
$230,500
Outstanding Balance
$148,932
Interest Rate
5.6%
Mortgage Type
New Conventional
Estimated Equity
$592,581
Purchase Details
Closed on
Dec 7, 2005
Sold by
Berg Investments Llc
Bought by
Delicino Jeremy M
Home Financials for this Owner
Home Financials are based on the most recent Mortgage that was taken out on this home.
Original Mortgage
$244,000
Interest Rate
6.14%
Mortgage Type
Unknown
Purchase Details
Closed on
Jun 23, 2005
Sold by
Nani Terry Wayne
Bought by
Berg Investments Llc
Purchase Details
Closed on
Apr 7, 2004
Sold by
Nani Terry
Bought by
Nani Terry Wayne
Home Financials for this Owner
Home Financials are based on the most recent Mortgage that was taken out on this home.
Original Mortgage
$257,934
Interest Rate
4.25%
Mortgage Type
VA
Purchase Details
Closed on
Oct 30, 2003
Sold by
Pranke Stephen C and Pranke Deanne E
Bought by
Nani Terry
Home Financials for this Owner
Home Financials are based on the most recent Mortgage that was taken out on this home.
Original Mortgage
$251,062
Interest Rate
5.94%
Mortgage Type
VA
Purchase Details
Closed on
Apr 26, 2002
Sold by
Pranke Deanne E and Pranke Stephen C
Bought by
Pranke Stephen C and Pranke Deanne E
Home Financials for this Owner
Home Financials are based on the most recent Mortgage that was taken out on this home.
Original Mortgage
$160,000
Interest Rate
7.13%
Purchase Details
Closed on
Nov 30, 1998
Sold by
Collett Samuel M
Bought by
Pranke Stephen C and Pranke Deanne E
Home Financials for this Owner
Home Financials are based on the most recent Mortgage that was taken out on this home.
Original Mortgage
$156,655
Interest Rate
6.69%
Purchase Details
Closed on
Jan 19, 1998
Sold by
Wahlen Thomas David and Wahlen Dao
Bought by
Collett Samuel M
Home Financials for this Owner
Home Financials are based on the most recent Mortgage that was taken out on this home.
Original Mortgage
$105,000
Interest Rate
7.05%
Purchase Details
Closed on
Apr 25, 1996
Sold by
Crockett Rebecca A
Bought by
Wahlen Thomas David and Wahlen Dao
Home Financials for this Owner
Home Financials are based on the most recent Mortgage that was taken out on this home.
Original Mortgage
$105,000
Interest Rate
7.84%
Create a Home Valuation Report for This Property
The Home Valuation Report is an in-depth analysis detailing your home's value as well as a comparison with similar homes in the area
Home Values in the Area
Average Home Value in this Area
Purchase History
| Date | Buyer | Sale Price | Title Company |
|---|---|---|---|
| Delicino Jeremiah M | -- | Title West | |
| Delicino Jeremy M | -- | Equity Title | |
| Berg Investments Llc | -- | Paramount Title | |
| Nani Terry Wayne | -- | Bonneville Title Co | |
| Nani Terry | -- | Equity Title | |
| Pranke Stephen C | -- | First American Title | |
| Pranke Stephen C | -- | -- | |
| Collett Samuel M | -- | -- | |
| Wahlen Thomas David | -- | -- |
Source: Public Records
Mortgage History
| Date | Status | Borrower | Loan Amount |
|---|---|---|---|
| Open | Delicino Jeremiah M | $230,500 | |
| Closed | Delicino Jeremy M | $244,000 | |
| Previous Owner | Nani Terry Wayne | $257,934 | |
| Previous Owner | Nani Terry | $251,062 | |
| Previous Owner | Pranke Stephen C | $160,000 | |
| Previous Owner | Pranke Stephen C | $156,655 | |
| Previous Owner | Collett Samuel M | $105,000 | |
| Previous Owner | Wahlen Thomas David | $105,000 |
Source: Public Records
Tax History Compared to Growth
Tax History
| Year | Tax Paid | Tax Assessment Tax Assessment Total Assessment is a certain percentage of the fair market value that is determined by local assessors to be the total taxable value of land and additions on the property. | Land | Improvement |
|---|---|---|---|---|
| 2025 | $3,381 | $679,600 | $206,000 | $473,600 |
| 2024 | $3,381 | $645,100 | $195,000 | $450,100 |
| 2023 | $3,381 | $567,000 | $197,900 | $369,100 |
| 2022 | $3,404 | $587,300 | $194,000 | $393,300 |
| 2021 | $3,099 | $484,200 | $143,400 | $340,800 |
| 2020 | $3,025 | $449,800 | $128,000 | $321,800 |
| 2019 | $3,139 | $439,100 | $120,600 | $318,500 |
| 2018 | $2,753 | $375,100 | $120,600 | $254,500 |
| 2017 | $2,885 | $368,200 | $120,600 | $247,600 |
| 2016 | $2,896 | $351,000 | $101,400 | $249,600 |
| 2015 | $2,731 | $313,700 | $99,300 | $214,400 |
| 2014 | $2,647 | $301,700 | $97,300 | $204,400 |
Source: Public Records
Map
Nearby Homes
- 1881 S 1100 E
- 1042 E Ramona Ave
- 1941 S 1000 E
- 1150 E 1700 S
- 951 Wilson Ave S
- 1843 S 900 E
- 1019 E 1700 S
- 1320 Wilson Ave S
- 936 E 1700 S
- 1133 Milton Ave
- 1155 Milton Ave
- 841 Ramona Ave
- 1712 S 900 E
- 1379 E Westminster Ave
- 866 E 1700 S
- 1946 S 1400 E
- 1592 S 1300 E
- 1978 S Windsor St
- 1201 E Wilmington Ave Unit 206
- 1145 Kensington Ave
- 1118 Garfield Ave
- 1124 E Garfield Ave Unit 2
- 1124 E Garfield Ave Unit 1
- 1124 E Garfield Ave
- 1124 Garfield Ave
- 1847 S 1100 E
- 1843 S 1100 E
- 1855 S 1100 E
- 1130 E Garfield Ave
- 1130 Garfield Ave
- 1859 S 1100 E
- 1829 S 1100 E
- 1139 Garfield Ave
- 1861 S 1100 E
- 1119 Westminster Ave
- 1825 S 1100 E
- 1150 E Garfield Ave
- 1865 S 1100 E
- 1127 E Westminster Ave
- 1127 Westminster Ave