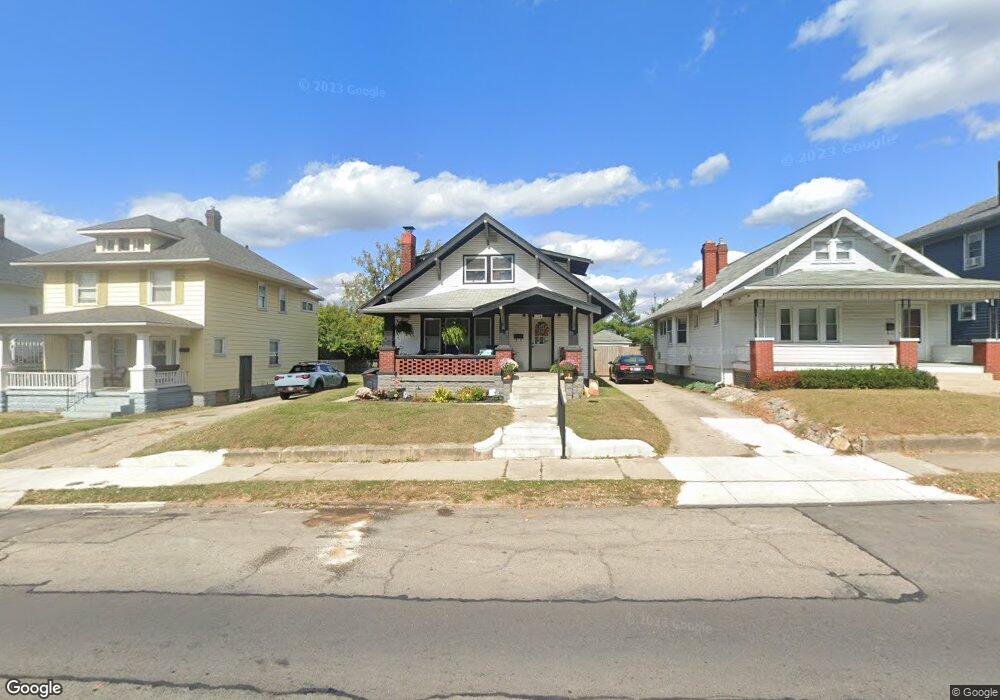
1118 E Main St Springfield, OH 45503
Estimated Value: $79,000 - $162,000
4
Beds
2
Baths
1,522
Sq Ft
$70/Sq Ft
Est. Value
About This Home
This home is located at 1118 E Main St, Springfield, OH 45503 and is currently estimated at $106,804, approximately $70 per square foot. 1118 E Main St is a home located in Clark County with nearby schools including Kenwood Elementary School, Schaefer Middle School, and Springfield High School.
Ownership History
Date
Name
Owned For
Owner Type
Purchase Details
Closed on
Dec 21, 2012
Sold by
Deutsche Bank National Trust Co
Bought by
Harding Brian
Current Estimated Value
Purchase Details
Closed on
Sep 19, 2012
Sold by
Geiger Joan E
Bought by
Deutsche Bank National Trust Co
Purchase Details
Closed on
Jan 28, 2000
Sold by
Morrow Joseph R and Morrow Cecily C
Bought by
Geiger Joan E
Home Financials for this Owner
Home Financials are based on the most recent Mortgage that was taken out on this home.
Original Mortgage
$57,000
Interest Rate
7.84%
Mortgage Type
Purchase Money Mortgage
Purchase Details
Closed on
Aug 3, 1999
Sold by
Parks Freda J
Bought by
Morrow Joseph R and Morrow Cecily C
Home Financials for this Owner
Home Financials are based on the most recent Mortgage that was taken out on this home.
Original Mortgage
$29,000
Interest Rate
10%
Mortgage Type
Seller Take Back
Create a Home Valuation Report for This Property
The Home Valuation Report is an in-depth analysis detailing your home's value as well as a comparison with similar homes in the area
Home Values in the Area
Average Home Value in this Area
Purchase History
| Date | Buyer | Sale Price | Title Company |
|---|---|---|---|
| Harding Brian | $16,500 | None Available | |
| Deutsche Bank National Trust Co | $20,000 | None Available | |
| Geiger Joan E | $59,000 | -- | |
| Morrow Joseph R | $32,000 | -- | |
| Morrow Joseph R | $32,000 | -- |
Source: Public Records
Mortgage History
| Date | Status | Borrower | Loan Amount |
|---|---|---|---|
| Previous Owner | Geiger Joan E | $57,000 | |
| Previous Owner | Morrow Joseph R | $29,000 |
Source: Public Records
Tax History
| Year | Tax Paid | Tax Assessment Tax Assessment Total Assessment is a certain percentage of the fair market value that is determined by local assessors to be the total taxable value of land and additions on the property. | Land | Improvement |
|---|---|---|---|---|
| 2025 | $938 | $24,270 | $2,850 | $21,420 |
| 2024 | $914 | $18,500 | $2,540 | $15,960 |
| 2023 | $914 | $18,500 | $2,540 | $15,960 |
| 2022 | $3,279 | $18,500 | $2,540 | $15,960 |
| 2021 | $814 | $14,810 | $2,040 | $12,770 |
| 2020 | $816 | $14,810 | $2,040 | $12,770 |
| 2019 | $818 | $14,810 | $2,040 | $12,770 |
| 2018 | $681 | $11,840 | $2,040 | $9,800 |
| 2017 | $681 | $11,837 | $2,037 | $9,800 |
| 2016 | $681 | $11,837 | $2,037 | $9,800 |
| 2015 | $7,006 | $12,908 | $2,037 | $10,871 |
| 2014 | $754 | $12,908 | $2,037 | $10,871 |
| 2013 | $3,303 | $12,908 | $2,037 | $10,871 |
Source: Public Records
Map
Nearby Homes
- 1105 Farlow St
- 1215 E High St
- 802 Warder St
- 1065 Mound St Unit 1067
- 315 Glenn Ave
- 321 Glenn Ave
- 1223 Lagonda Ave
- 360 S Greenmount Ave
- 1621 Morgan St
- 1585 Mound St
- 1664 Warder St
- 453 E Pleasant St
- 1721 Prospect St
- 1609 Irwin Ave
- 803 Laurel St
- 1654 Catawba Ave
- 26 N Belmont Ave
- 718 Summer St
- 726 E Madison Ave
- 1634 Edwards Ave
- 1114 E Main St
- 1122 E Main St
- 1124 E Main St Unit 1126
- 1112 E Main St
- 1132 E Main St
- 1100 E Main St Unit 1104
- 1117 Highland Ave
- 1115 Highland Ave
- 14 N Freeman St
- 1119 Highland Ave
- 1134 E Main St
- 1123 Highland Ave Unit 1125
- 1125 E Main St
- 16 N Freeman St Unit 18
- 1140 E Main St
- 1129 E Main St
- 1 N Freeman St
- 1109 E Main St
- 5 N Freeman St
- 9 N Freeman St
Your Personal Tour Guide
Ask me questions while you tour the home.