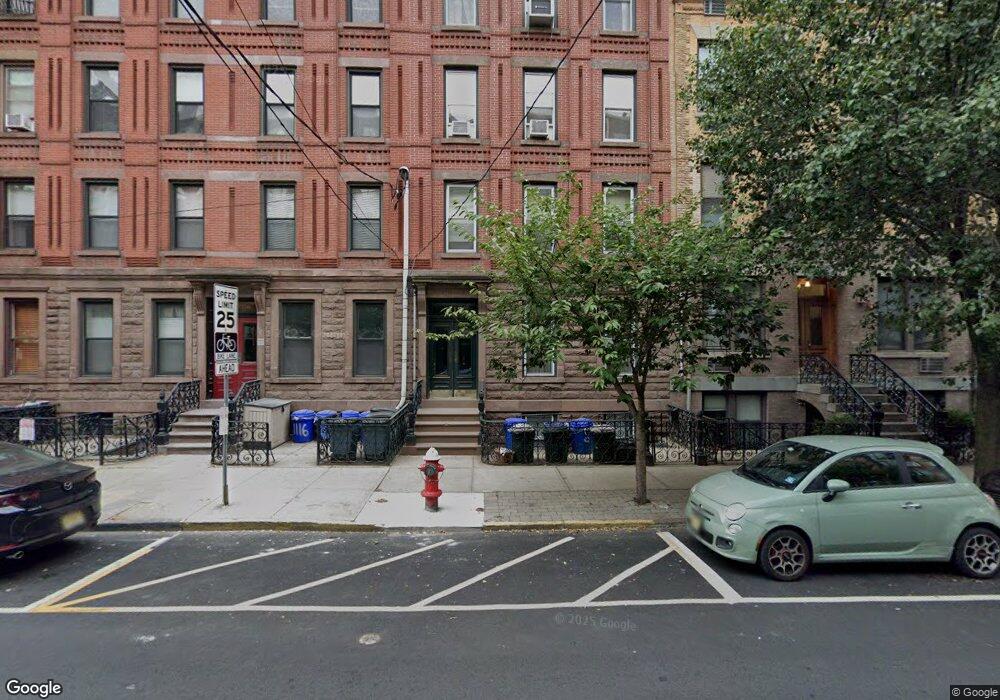
1118 Hudson St Unit 2 Hoboken, NJ 07030
Estimated Value: $770,000 - $898,000
2
Beds
1
Bath
1,100
Sq Ft
$736/Sq Ft
Est. Value
About This Home
This home is located at 1118 Hudson St Unit 2, Hoboken, NJ 07030 and is currently estimated at $809,385, approximately $735 per square foot. 1118 Hudson St Unit 2 is a home located in Hudson County with nearby schools including Hoboken High School, Elysian Charter School of Hoboken, and Hoboken Charter School.
Ownership History
Date
Name
Owned For
Owner Type
Purchase Details
Closed on
Feb 17, 2012
Sold by
Batcha Thomas Courtney and Batch Susan Dolan
Bought by
Tevlin Thomas and Tevlin Leslie
Current Estimated Value
Home Financials for this Owner
Home Financials are based on the most recent Mortgage that was taken out on this home.
Original Mortgage
$475,200
Outstanding Balance
$327,117
Interest Rate
3.99%
Mortgage Type
Purchase Money Mortgage
Estimated Equity
$482,268
Purchase Details
Closed on
May 17, 2006
Sold by
Welsz Daniel and Welsz Kimberly
Bought by
Batcha Thomas Courteray and Dolan Susan
Purchase Details
Closed on
May 14, 2001
Sold by
1118 Hudson St Llc
Bought by
Weisz Daniel and Weisz Kimberly
Home Financials for this Owner
Home Financials are based on the most recent Mortgage that was taken out on this home.
Original Mortgage
$244,000
Interest Rate
7.2%
Create a Home Valuation Report for This Property
The Home Valuation Report is an in-depth analysis detailing your home's value as well as a comparison with similar homes in the area
Home Values in the Area
Average Home Value in this Area
Purchase History
| Date | Buyer | Sale Price | Title Company |
|---|---|---|---|
| Tevlin Thomas | $594,000 | -- | |
| Batcha Thomas Courteray | $590,940 | None Available | |
| Weisz Daniel | $305,000 | -- |
Source: Public Records
Mortgage History
| Date | Status | Borrower | Loan Amount |
|---|---|---|---|
| Open | Tevlin Thomas | $475,200 | |
| Previous Owner | Weisz Daniel | $244,000 |
Source: Public Records
Tax History Compared to Growth
Tax History
| Year | Tax Paid | Tax Assessment Tax Assessment Total Assessment is a certain percentage of the fair market value that is determined by local assessors to be the total taxable value of land and additions on the property. | Land | Improvement |
|---|---|---|---|---|
| 2025 | $8,636 | $489,000 | $223,700 | $265,300 |
| 2024 | $7,966 | $489,000 | $223,700 | $265,300 |
| 2023 | $7,966 | $489,000 | $223,700 | $265,300 |
| 2022 | $7,829 | $489,000 | $223,700 | $265,300 |
| 2021 | $8,643 | $540,200 | $223,700 | $316,500 |
| 2020 | $8,703 | $540,200 | $223,700 | $316,500 |
| 2019 | $8,638 | $540,200 | $223,700 | $316,500 |
| 2018 | $8,535 | $540,200 | $223,700 | $316,500 |
| 2017 | $8,600 | $540,200 | $223,700 | $316,500 |
| 2016 | $8,379 | $540,200 | $223,700 | $316,500 |
| 2015 | $8,087 | $540,200 | $223,700 | $316,500 |
| 2014 | $7,714 | $540,200 | $223,700 | $316,500 |
Source: Public Records
Map
Nearby Homes
- 1100 Maxwell Ln Unit 303
- 1100 Maxwell Ln Unit 418
- 1100 Maxwell Ln Unit 406
- 1100 Maxwell Ln Unit 238
- 1100 Maxwell Ln Unit 215
- 1216 Washington St Unit 3S
- 1027 Washington St Unit 2F
- 1027 Washington St Unit 4F
- 1026 Washington St Unit 2F
- 1125 Maxwell Ln Unit 809
- 1125 Maxwell Ln Unit 711
- 1125 Maxwell Ln Unit 1021
- 1233 Bloomfield St
- 161 12th St
- 1029 Bloomfield St
- 1025 Maxwell Ln Unit 1104
- 1025 Maxwell Ln Unit 1201
- 1425 Hudson St Unit 2K
- 1425 Hudson St Unit 11A
- 1112 Garden St
- 1118 Hudson St Unit 4
- 1118 Hudson St Unit 1
- 1118 Hudson St
- 1118 Hudson St Unit 3
- 1118 Hudson St Unit 5
- 1118 Hudson St Unit 6
- 1120 Hudson St Unit 7
- 1120 Hudson St Unit 10
- 1120 Hudson St Unit 9
- 1120 Hudson St Unit 8
- 1120 Hudson St Unit 2
- 1120 Hudson St Unit 3
- 1120 Hudson St Unit 4
- 1120 Hudson St
- 1120 Hudson St Unit 6
- 1120 Hudson St
- 1120 Hudson St Unit 1
- 1116 Hudson St Unit 3R
- 1116 Hudson St Unit 2R
- 1116 Hudson St Unit 5L