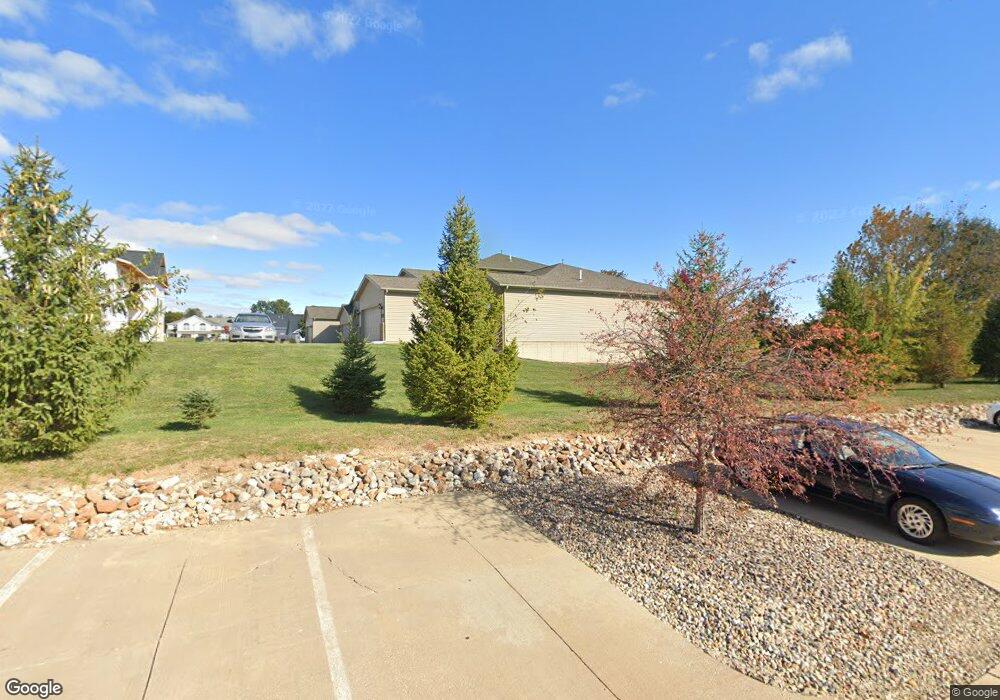
1118 Jessie St Washington, IL 61571
Hillcrest NeighborhoodEstimated Value: $196,000 - $244,000
2
Beds
2
Baths
1,424
Sq Ft
$149/Sq Ft
Est. Value
About This Home
This home is located at 1118 Jessie St, Washington, IL 61571 and is currently estimated at $211,914, approximately $148 per square foot. 1118 Jessie St is a home located in Tazewell County with nearby schools including Central Primary School, Central Intermediate School, and Washington Community High School.
Ownership History
Date
Name
Owned For
Owner Type
Purchase Details
Closed on
Mar 20, 2023
Sold by
Ghidorah Llc
Bought by
Hillside Dev Partners Llc
Current Estimated Value
Home Financials for this Owner
Home Financials are based on the most recent Mortgage that was taken out on this home.
Original Mortgage
$672,000
Outstanding Balance
$526,159
Interest Rate
3.64%
Mortgage Type
Credit Line Revolving
Estimated Equity
-$314,245
Purchase Details
Closed on
Sep 13, 2018
Sold by
Marc Wells Inc
Bought by
Ghidorah Llc
Create a Home Valuation Report for This Property
The Home Valuation Report is an in-depth analysis detailing your home's value as well as a comparison with similar homes in the area
Home Values in the Area
Average Home Value in this Area
Purchase History
| Date | Buyer | Sale Price | Title Company |
|---|---|---|---|
| Hillside Dev Partners Llc | -- | None Listed On Document | |
| Ghidorah Llc | -- | None Available |
Source: Public Records
Mortgage History
| Date | Status | Borrower | Loan Amount |
|---|---|---|---|
| Open | Hillside Dev Partners Llc | $672,000 |
Source: Public Records
Tax History Compared to Growth
Tax History
| Year | Tax Paid | Tax Assessment Tax Assessment Total Assessment is a certain percentage of the fair market value that is determined by local assessors to be the total taxable value of land and additions on the property. | Land | Improvement |
|---|---|---|---|---|
| 2024 | $4,366 | $57,030 | $5,670 | $51,360 |
| 2023 | $4,366 | $48,650 | $5,260 | $43,390 |
| 2022 | $4,191 | $45,450 | $4,910 | $40,540 |
| 2021 | $4,036 | $44,330 | $4,790 | $39,540 |
| 2020 | $3,979 | $44,330 | $4,790 | $39,540 |
| 2019 | $3,887 | $44,330 | $4,790 | $39,540 |
| 2018 | $4,471 | $52,260 | $4,790 | $47,470 |
| 2017 | $4,325 | $50,800 | $4,660 | $46,140 |
| 2016 | $4,210 | $50,800 | $4,660 | $46,140 |
| 2015 | $4,148 | $0 | $0 | $0 |
| 2013 | $3,865 | $50,800 | $4,660 | $46,140 |
Source: Public Records
Map
Nearby Homes