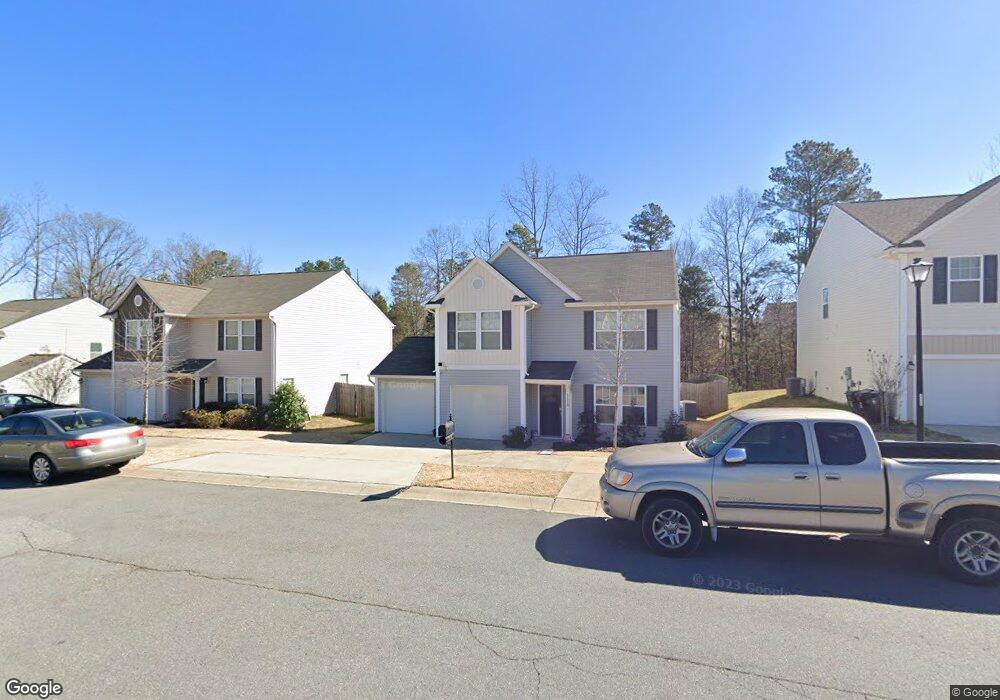
1118 Manston Place SW Concord, NC 28025
Estimated Value: $320,209 - $358,000
3
Beds
3
Baths
2,068
Sq Ft
$165/Sq Ft
Est. Value
About This Home
This home is located at 1118 Manston Place SW, Concord, NC 28025 and is currently estimated at $342,052, approximately $165 per square foot. 1118 Manston Place SW is a home located in Cabarrus County with nearby schools including A.T. Allen Elementary School, C.C. Griffin Middle School, and Central Cabarrus High School.
Ownership History
Date
Name
Owned For
Owner Type
Purchase Details
Closed on
Aug 21, 2014
Sold by
True Homes Llc
Bought by
Crawford Terri J
Current Estimated Value
Home Financials for this Owner
Home Financials are based on the most recent Mortgage that was taken out on this home.
Original Mortgage
$147,959
Outstanding Balance
$112,827
Interest Rate
4.19%
Mortgage Type
New Conventional
Estimated Equity
$229,225
Purchase Details
Closed on
May 23, 2014
Sold by
Wellspring Carolina Investments Llc
Bought by
True Homes Llc
Purchase Details
Closed on
Aug 26, 2011
Sold by
Crm Mid Atlantic Properties Llc
Bought by
Wellspring Carolina Investments Llc
Purchase Details
Closed on
May 1, 2011
Sold by
Moser Dan Company Inc Nc Corp
Bought by
Crm Mid-Atlantic Properts Llc
Create a Home Valuation Report for This Property
The Home Valuation Report is an in-depth analysis detailing your home's value as well as a comparison with similar homes in the area
Home Values in the Area
Average Home Value in this Area
Purchase History
| Date | Buyer | Sale Price | Title Company |
|---|---|---|---|
| Crawford Terri J | $144,000 | None Available | |
| True Homes Llc | $14,500 | None Available | |
| Wellspring Carolina Investments Llc | $390,500 | None Available | |
| Crm Mid-Atlantic Properts Llc | $430,500 | -- |
Source: Public Records
Mortgage History
| Date | Status | Borrower | Loan Amount |
|---|---|---|---|
| Open | Crawford Terri J | $147,959 |
Source: Public Records
Tax History Compared to Growth
Tax History
| Year | Tax Paid | Tax Assessment Tax Assessment Total Assessment is a certain percentage of the fair market value that is determined by local assessors to be the total taxable value of land and additions on the property. | Land | Improvement |
|---|---|---|---|---|
| 2025 | $3,200 | $321,290 | $68,000 | $253,290 |
| 2024 | $3,200 | $321,290 | $68,000 | $253,290 |
| 2023 | $2,585 | $211,870 | $40,000 | $171,870 |
| 2022 | $2,585 | $211,870 | $40,000 | $171,870 |
| 2021 | $2,585 | $211,870 | $40,000 | $171,870 |
| 2020 | $2,585 | $211,870 | $40,000 | $171,870 |
| 2019 | $2,007 | $164,500 | $20,000 | $144,500 |
| 2018 | $1,928 | $160,630 | $20,000 | $140,630 |
| 2017 | $1,895 | $160,630 | $20,000 | $140,630 |
| 2016 | $1,124 | $142,820 | $24,000 | $118,820 |
| 2015 | $283 | $24,000 | $24,000 | $0 |
| 2014 | $283 | $24,000 | $24,000 | $0 |
Source: Public Records
Map
Nearby Homes
- 4194 Clifftonville Ave SW
- 3931 Kellybrook Dr
- 1051 Manston Place SW
- 4183 Broadstairs Dr
- 4175 Broadstairs Dr
- 4425 Norfleet St
- 668 Shellbark Dr
- 760 Bartram Ave Unit 114
- 4285 Long Arrow Dr
- 1130 Brigadoon Ct
- 1009 Braxton Dr
- 1001 Loch Lomond Cir
- 4813 Adamshire Ave
- 5248 Ellie Ct
- 4227 Kiser Woods Dr SW
- 3560 Us Highway 601 S
- 123 Softwind Ln
- 5582 Flowes Store Rd
- 137 Softwind Ln
- 707 Pointe Andrews Dr SW
- 1118 Manston Place SW Unit 36
- 1114 Manston Place SW
- 1122 Manston Place SW
- 1110 Manston Place SW
- 1110 Manston Place SW
- 1110 Manston Place SW Unit 38
- 1126 Manston Place SW
- 4178 Clifftonville Ave SW Unit 196
- 4178 Clifftonville Ave SW
- 1130 Manston Place SW
- 1121 Manston Place SW
- 1125 Manston Place SW
- 4466 Kellybrook Dr
- 4466 Kellybrook Dr
- 4466 Kellybrook Dr Unit 19
- 4182 Clifftonville Ave SW
- 4458 Kellybrook Dr
- 4470 Kellybrook Dr
- 4454 Kellybrook Dr
- 4474 Kellybrook Dr