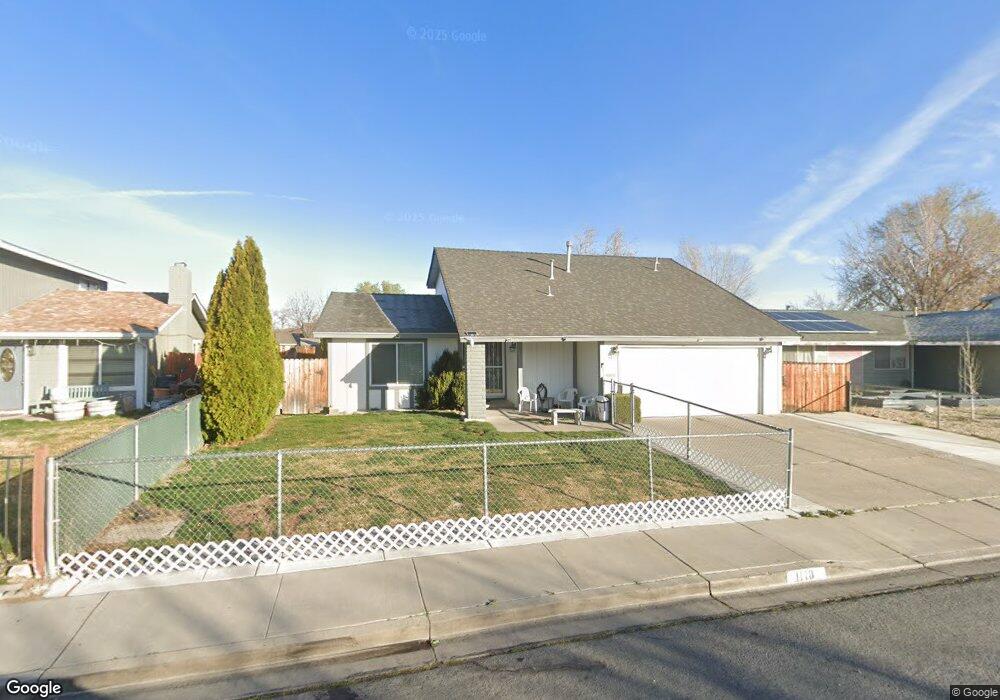
1118 O Callaghan Dr Sparks, NV 89434
O'Callaghan NeighborhoodEstimated Value: $481,402 - $504,000
4
Beds
3
Baths
1,984
Sq Ft
$249/Sq Ft
Est. Value
About This Home
This home is located at 1118 O Callaghan Dr, Sparks, NV 89434 and is currently estimated at $493,351, approximately $248 per square foot. 1118 O Callaghan Dr is a home located in Washoe County with nearby schools including Katherine Dunn Elementary School, George L Dilworth Middle School, and Edward C Reed High School.
Ownership History
Date
Name
Owned For
Owner Type
Purchase Details
Closed on
Feb 4, 1999
Sold by
Norton Brenda M
Bought by
Norton Robert A
Current Estimated Value
Home Financials for this Owner
Home Financials are based on the most recent Mortgage that was taken out on this home.
Original Mortgage
$120,000
Interest Rate
6.79%
Create a Home Valuation Report for This Property
The Home Valuation Report is an in-depth analysis detailing your home's value as well as a comparison with similar homes in the area
Home Values in the Area
Average Home Value in this Area
Purchase History
| Date | Buyer | Sale Price | Title Company |
|---|---|---|---|
| Norton Robert A | -- | Stewart Title Company |
Source: Public Records
Mortgage History
| Date | Status | Borrower | Loan Amount |
|---|---|---|---|
| Closed | Norton Robert A | $120,000 |
Source: Public Records
Tax History Compared to Growth
Tax History
| Year | Tax Paid | Tax Assessment Tax Assessment Total Assessment is a certain percentage of the fair market value that is determined by local assessors to be the total taxable value of land and additions on the property. | Land | Improvement |
|---|---|---|---|---|
| 2025 | $1,460 | $64,494 | $37,275 | $27,219 |
| 2024 | $1,460 | $59,391 | $32,620 | $26,771 |
| 2023 | $1,418 | $56,517 | $31,710 | $24,807 |
| 2022 | $1,377 | $48,895 | $27,475 | $21,420 |
| 2021 | $1,338 | $43,217 | $21,175 | $22,042 |
| 2020 | $1,297 | $43,299 | $20,510 | $22,789 |
| 2019 | $1,266 | $41,561 | $18,865 | $22,696 |
| 2018 | $1,223 | $36,213 | $13,405 | $22,808 |
| 2017 | $1,187 | $35,690 | $12,810 | $22,880 |
| 2016 | $1,156 | $36,265 | $12,355 | $23,910 |
| 2015 | $1,154 | $34,114 | $9,695 | $24,419 |
| 2014 | $1,104 | $31,883 | $8,435 | $23,448 |
| 2013 | -- | $29,285 | $6,055 | $23,230 |
Source: Public Records
Map
Nearby Homes
- 1118 Alta Vista Ct
- 1758 Woodhaven Ln
- 1973 Rio Tinto Dr
- 1161 Jason Dr
- 1051 Jason Dr
- 2138 Rizzo Dr
- 1544 Woodhaven Ln
- 2154 La Hacienda Dr
- 1728 Bluehaven Dr
- 1298 Highgate Ct
- 1218 Junction Dr
- 1230 Junction Dr
- 1687 Noreen Dr
- 1821 Fargo Way
- 1332 Coachman Ct
- 1044 Glen Martin Dr
- 1273 Junction Dr
- 857 Cherry Tree Dr Unit 3
- 1295 Pullman Ct
- 1095 E York Way
- 1124 O Callaghan Dr
- 1114 O Callaghan Dr
- 1124 O'Callaghan Dr
- 1826 Bonita Vista Dr
- 1836 Bonita Vista Dr
- 1812 Bonita Vista Dr
- 1128 O Callaghan Dr
- 1108 O Callaghan Dr
- 1866 Bonita Vista Dr
- 1800 Bonita Vista Dr
- 1132 O Callaghan Dr
- 1872 Bonita Vista Dr
- 1827 Bonita Vista Dr
- 1813 Bonita Vista Dr
- 1837 Bonita Vista Dr
- 1136 O Callaghan Ct
- 1867 Bonita Vista Dr
- 1061 Norris Dr Unit 5B
- 1896 Bonita Vista Dr
- 1030 Norris Dr