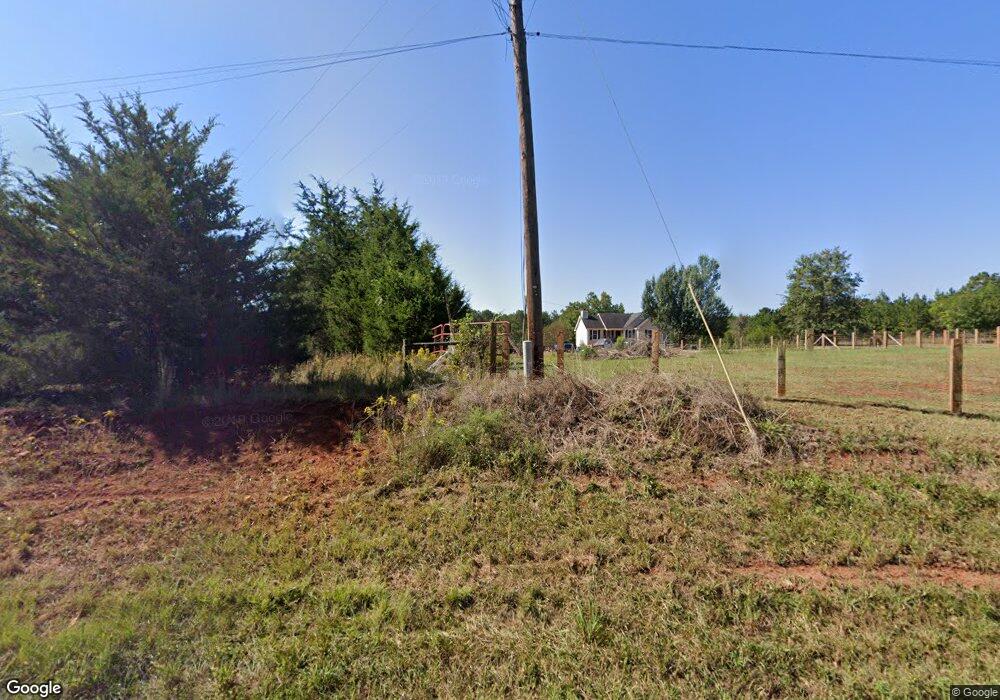
1118 Roberts Quarters Rd Concord, GA 30206
Estimated Value: $280,000 - $390,000
--
Bed
2
Baths
2,220
Sq Ft
$156/Sq Ft
Est. Value
About This Home
This home is located at 1118 Roberts Quarters Rd, Concord, GA 30206 and is currently estimated at $347,275, approximately $156 per square foot. 1118 Roberts Quarters Rd is a home located in Pike County with nearby schools including Pike County Primary School, Pike County Elementary School, and Pike County Middle School.
Ownership History
Date
Name
Owned For
Owner Type
Purchase Details
Closed on
Jan 20, 2021
Sold by
Wilson Gregory William
Bought by
Wilson Ashley Elizabeth
Current Estimated Value
Purchase Details
Closed on
Aug 10, 2007
Sold by
Corrow Edward
Bought by
Wilson Greg
Home Financials for this Owner
Home Financials are based on the most recent Mortgage that was taken out on this home.
Original Mortgage
$151,900
Interest Rate
6.65%
Mortgage Type
New Conventional
Purchase Details
Closed on
Aug 21, 1998
Sold by
Corrow Edward Lee
Bought by
Corrow Edward Lee and Ann Marie
Purchase Details
Closed on
Dec 13, 1993
Sold by
Evans F J
Bought by
Corrow Edward Lee
Purchase Details
Closed on
Jul 2, 1993
Sold by
Tumpane Bolton W and Tumpane James R
Bought by
Evans F J
Purchase Details
Closed on
Nov 12, 1991
Bought by
Tumpane Bolton W and Tumpane James R
Create a Home Valuation Report for This Property
The Home Valuation Report is an in-depth analysis detailing your home's value as well as a comparison with similar homes in the area
Home Values in the Area
Average Home Value in this Area
Purchase History
| Date | Buyer | Sale Price | Title Company |
|---|---|---|---|
| Wilson Ashley Elizabeth | -- | -- | |
| Wilson Greg | $159,900 | -- | |
| Corrow Edward Lee | -- | -- | |
| Corrow Edward Lee | $78,900 | -- | |
| Evans F J | $10,000 | -- | |
| Tumpane Bolton W | -- | -- | |
| Tumpane Bolton W | -- | -- |
Source: Public Records
Mortgage History
| Date | Status | Borrower | Loan Amount |
|---|---|---|---|
| Previous Owner | Wilson Greg | $151,900 |
Source: Public Records
Tax History Compared to Growth
Tax History
| Year | Tax Paid | Tax Assessment Tax Assessment Total Assessment is a certain percentage of the fair market value that is determined by local assessors to be the total taxable value of land and additions on the property. | Land | Improvement |
|---|---|---|---|---|
| 2024 | $2,086 | $84,154 | $22,071 | $62,083 |
| 2023 | $2,442 | $84,154 | $22,071 | $62,083 |
| 2022 | $1,875 | $64,617 | $22,071 | $42,546 |
| 2021 | $1,561 | $53,877 | $11,331 | $42,546 |
| 2020 | $1,579 | $53,877 | $11,331 | $42,546 |
| 2019 | $1,626 | $48,984 | $11,331 | $37,653 |
| 2018 | $1,627 | $48,984 | $11,331 | $37,653 |
| 2017 | $1,614 | $48,984 | $11,331 | $37,653 |
| 2016 | $1,498 | $48,984 | $11,331 | $37,653 |
| 2015 | $1,425 | $48,984 | $11,331 | $37,653 |
| 2014 | $1,446 | $48,984 | $11,331 | $37,653 |
| 2013 | -- | $48,984 | $11,330 | $37,653 |
Source: Public Records
Map
Nearby Homes
- 1337 Green St
- 10000 Highway 18 W
- L-8 Strickland Rd
- 0 Green St Unit 20083878
- 0 W Fossett Rd Unit 10629253
- LOT 12 Flint Farms Dr
- 184 Flint Farms Dr
- 243 Flint Farms Dr
- 126 Flint Farms Dr
- LOT 11 Flint Farms Dr
- TRACT 5 Bates Rd (13 98acs)
- 0 Collier Rd Unit 25031854
- 0 Collier Rd Unit 10493888
- TRACT 2 Bates Rd (56 99acs)
- TRACT 1 Bates Rd (14 05acs)
- 0 West Rd Unit 10536330
- 0 West Rd Unit 10541322
- TB1 Roberts Quarters Rd
- 2505 Plan at Ashley Glen
- 2604 Plan at Ashley Glen
- L-7 Roberts Quarters Rd
- 1016 Roberts Quarters Rd
- 1051 Roberts Quarters Rd
- 1195 Roberts Quarters Rd
- 1195 Roberts Quarters Rd
- 247 Harris Rd Unit 3
- 221 Harris Rd
- 1041 Roberts Quarters Rd
- 1250 Roberts Quarters Rd
- 291 Harris Rd
- 941 Roberts Quarters Rd
- 1111 Roberts Quarters Rd
- 339 Harris Rd
- 1345 Roberts Quarters Rd
- 811 Roberts Quarters Rd
- 846 Roberts Quarters Rd
- 452 Harris Rd
- 847 Roberts Quarters Rd
- 399 Harris Rd
- 1352 Roberts Quarters Rd