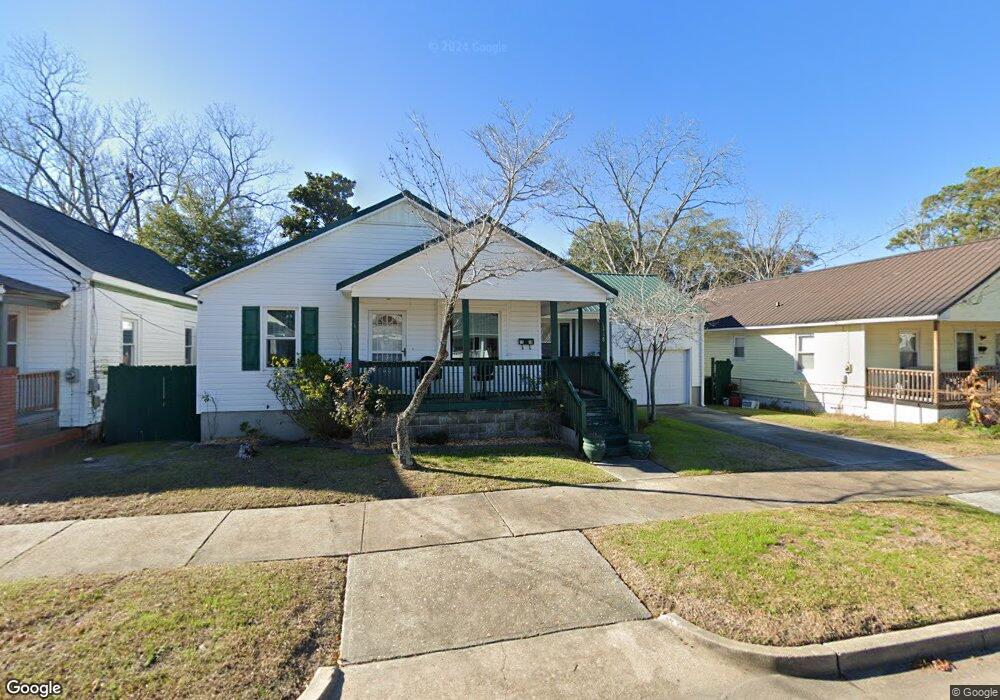
1118 S 8th St Wilmington, NC 28401
Dry Pond-South Side NeighborhoodEstimated Value: $229,000 - $389,000
3
Beds
2
Baths
1,456
Sq Ft
$222/Sq Ft
Est. Value
About This Home
This home is located at 1118 S 8th St, Wilmington, NC 28401 and is currently estimated at $323,059, approximately $221 per square foot. 1118 S 8th St is a home located in New Hanover County with nearby schools including Forest Hills Global Elementary School, Myrtle Grove Middle School, and John T. Hoggard High School.
Ownership History
Date
Name
Owned For
Owner Type
Purchase Details
Closed on
Nov 21, 2023
Sold by
Mcintyre Doris V Cromartie
Bought by
Mcintyre Family Trust and Mcintyre
Current Estimated Value
Purchase Details
Closed on
Jul 23, 1996
Sold by
Burner William N Ethel A
Bought by
Mcintyre Doris V Cromartie
Purchase Details
Closed on
Feb 7, 1996
Sold by
Jones Lewis D
Bought by
Burner William N
Purchase Details
Closed on
Jul 1, 1987
Sold by
Jones Lewis D
Bought by
Jones Lewis D
Purchase Details
Closed on
May 23, 1985
Sold by
Sharpless Theodore Pearl
Bought by
Jones Lewis D
Purchase Details
Closed on
Dec 1, 1978
Bought by
Sharpless Theodore Pearl
Create a Home Valuation Report for This Property
The Home Valuation Report is an in-depth analysis detailing your home's value as well as a comparison with similar homes in the area
Home Values in the Area
Average Home Value in this Area
Purchase History
| Date | Buyer | Sale Price | Title Company |
|---|---|---|---|
| Mcintyre Family Trust | -- | None Listed On Document | |
| Mcintyre Doris V Cromartie | $74,500 | -- | |
| Burner William N | -- | -- | |
| Jones Lewis D | $3,500 | -- | |
| Jones Lewis D | $3,500 | -- | |
| Sharpless Theodore Pearl | -- | -- |
Source: Public Records
Tax History Compared to Growth
Tax History
| Year | Tax Paid | Tax Assessment Tax Assessment Total Assessment is a certain percentage of the fair market value that is determined by local assessors to be the total taxable value of land and additions on the property. | Land | Improvement |
|---|---|---|---|---|
| 2025 | $2,290 | $380,100 | $62,300 | $317,800 |
| 2023 | $2,290 | $263,200 | $46,900 | $216,300 |
| 2022 | $2,237 | $263,200 | $46,900 | $216,300 |
| 2021 | $2,252 | $263,200 | $46,900 | $216,300 |
| 2020 | $1,283 | $121,800 | $42,900 | $78,900 |
| 2019 | $1,283 | $121,800 | $42,900 | $78,900 |
| 2018 | $1,283 | $121,800 | $42,900 | $78,900 |
| 2017 | $1,283 | $121,800 | $42,900 | $78,900 |
| 2016 | $2,050 | $185,000 | $61,000 | $124,000 |
| 2015 | $1,959 | $185,000 | $61,000 | $124,000 |
| 2014 | $1,876 | $185,000 | $61,000 | $124,000 |
Source: Public Records
Map
Nearby Homes