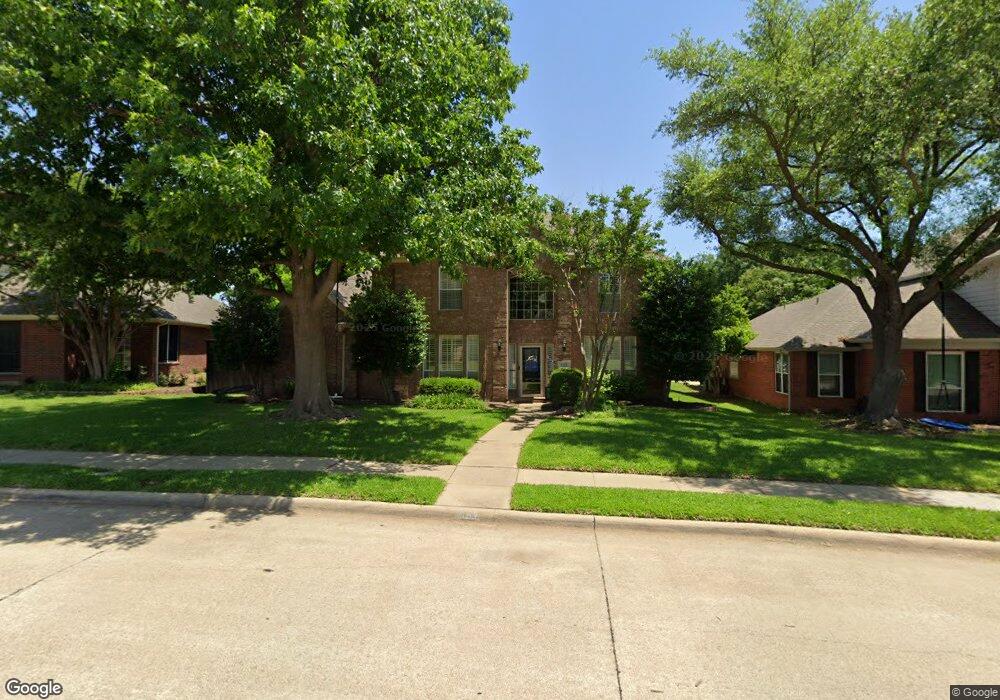
1118 Shadetree Ln Allen, TX 75013
Twin Creeks NeighborhoodEstimated Value: $639,291 - $722,000
4
Beds
4
Baths
3,015
Sq Ft
$224/Sq Ft
Est. Value
About This Home
This home is located at 1118 Shadetree Ln, Allen, TX 75013 and is currently estimated at $674,323, approximately $223 per square foot. 1118 Shadetree Ln is a home located in Collin County with nearby schools including Dr. E.T. Boon Elementary School, Ereckson Middle School, and Lowery Freshman Center.
Ownership History
Date
Name
Owned For
Owner Type
Purchase Details
Closed on
Apr 16, 2009
Sold by
Southwell Brian and Southwell Kimberly
Bought by
Cunningham Timothy R and Cunningham Michelle L
Current Estimated Value
Home Financials for this Owner
Home Financials are based on the most recent Mortgage that was taken out on this home.
Original Mortgage
$233,689
Outstanding Balance
$149,308
Interest Rate
5.14%
Mortgage Type
FHA
Estimated Equity
$525,015
Purchase Details
Closed on
Oct 30, 1998
Sold by
King Bradley Michael and King Beth Ann Taliaferro
Bought by
Southwell Brian and Southwell Kimberly
Home Financials for this Owner
Home Financials are based on the most recent Mortgage that was taken out on this home.
Original Mortgage
$179,200
Interest Rate
6.57%
Purchase Details
Closed on
Aug 25, 1993
Sold by
Pacific American Homes Inc
Bought by
King Bradley Michael and Taliaferro Beth Ann
Home Financials for this Owner
Home Financials are based on the most recent Mortgage that was taken out on this home.
Original Mortgage
$130,950
Interest Rate
7.23%
Create a Home Valuation Report for This Property
The Home Valuation Report is an in-depth analysis detailing your home's value as well as a comparison with similar homes in the area
Home Values in the Area
Average Home Value in this Area
Purchase History
| Date | Buyer | Sale Price | Title Company |
|---|---|---|---|
| Cunningham Timothy R | -- | Ct | |
| Southwell Brian | -- | -- | |
| King Bradley Michael | -- | -- |
Source: Public Records
Mortgage History
| Date | Status | Borrower | Loan Amount |
|---|---|---|---|
| Open | Cunningham Timothy R | $233,689 | |
| Previous Owner | Southwell Brian | $179,200 | |
| Previous Owner | King Bradley Michael | $130,950 | |
| Closed | King Bradley Michael | $8,150 | |
| Closed | Southwell Brian | $22,400 |
Source: Public Records
Tax History Compared to Growth
Tax History
| Year | Tax Paid | Tax Assessment Tax Assessment Total Assessment is a certain percentage of the fair market value that is determined by local assessors to be the total taxable value of land and additions on the property. | Land | Improvement |
|---|---|---|---|---|
| 2025 | $7,890 | $574,435 | $150,000 | $430,414 |
| 2024 | $7,890 | $522,214 | $150,000 | $405,653 |
| 2023 | $7,890 | $474,740 | $125,000 | $439,953 |
| 2022 | $8,568 | $431,582 | $110,000 | $393,170 |
| 2021 | $8,342 | $392,347 | $95,000 | $297,347 |
| 2020 | $8,324 | $377,674 | $85,000 | $292,674 |
| 2019 | $8,887 | $384,705 | $85,000 | $299,705 |
| 2018 | $8,821 | $375,035 | $85,000 | $290,035 |
| 2017 | $8,371 | $358,000 | $85,000 | $273,000 |
| 2016 | $7,764 | $348,933 | $75,000 | $273,933 |
| 2015 | $6,399 | $309,238 | $65,000 | $244,238 |
Source: Public Records
Map
Nearby Homes
- 1123 Shadetree Ln
- 1210 Edgewood Ln
- 604 Pilot Point Dr
- 1121 Sophia St
- 505 Cutter Ln
- 112 Brentwood Ct
- 321 Phoebe Dr
- 1101 Fairfax Dr
- 1038 Audrey Way
- 1029 Audrey Way
- 1208 Granger Dr
- 1013 Taylor Dr
- 1017 Lucy Ln
- 1400 Cool Springs Dr
- 1212 Cordova Dr
- 1013 Lucy Ln
- 102 Fontana Ct
- 1411 Brandon Ct
- 321 Beacon Hill Dr
- 1432 Abilene Ct
- 1116 Shadetree Ln
- 1120 Shadetree Ln
- 501 Saginaw Ct
- 1114 Shadetree Ln
- 1122 Shadetree Ln
- 500 Saginaw Ct
- 1119 Shadetree Ln
- 1117 Shadetree Ln
- 503 Saginaw Ct
- 1124 Shadetree Ln
- 1112 Shadetree Ln
- 1121 Shadetree Ln
- 1115 Shadetree Ln
- 1109 Dunlay Ct
- 1108 Dunlay Ct
- 1110 Shadetree Ln
- 1126 Shadetree Ln
- 502 Saginaw Ct
- 500 Overhill Dr
- 505 Saginaw Ct