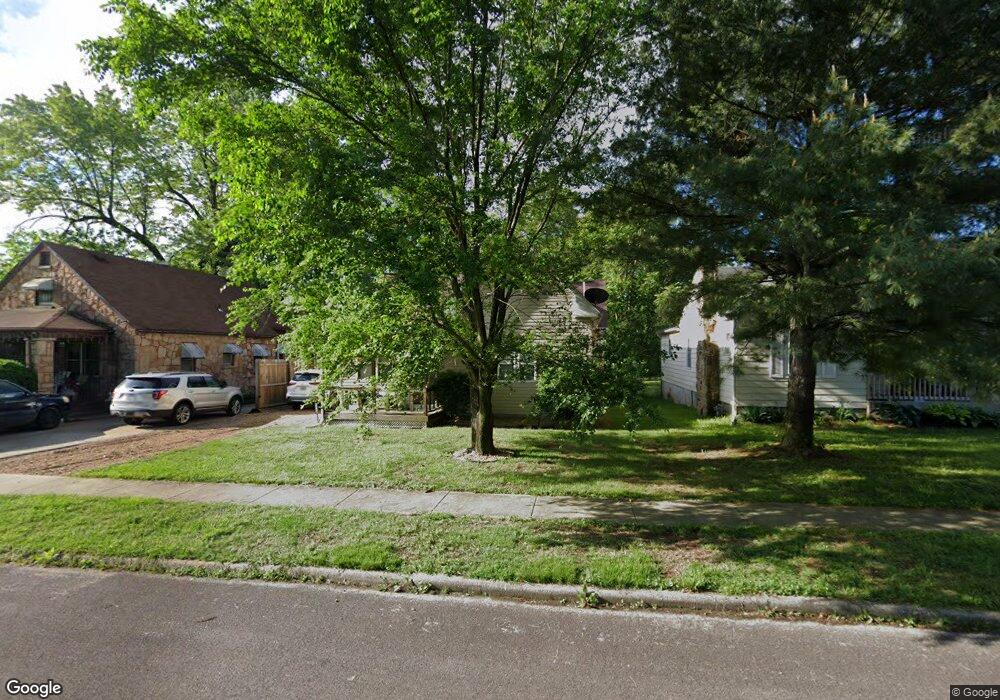
1118 W Hovey St Springfield, MO 65802
Grant Beach NeighborhoodEstimated Value: $152,000 - $184,000
3
Beds
2
Baths
1,392
Sq Ft
$120/Sq Ft
Est. Value
About This Home
This home is located at 1118 W Hovey St, Springfield, MO 65802 and is currently estimated at $166,898, approximately $119 per square foot. 1118 W Hovey St is a home located in Greene County with nearby schools including Weaver Elementary School, Pipkin Middle School, and Central High School.
Ownership History
Date
Name
Owned For
Owner Type
Purchase Details
Closed on
Sep 22, 2011
Sold by
Sansom Kirk
Bought by
Quinn Thomas and Quinn Carol
Current Estimated Value
Home Financials for this Owner
Home Financials are based on the most recent Mortgage that was taken out on this home.
Original Mortgage
$63,254
Outstanding Balance
$43,295
Interest Rate
4.25%
Mortgage Type
FHA
Estimated Equity
$123,603
Purchase Details
Closed on
Nov 17, 2009
Sold by
Zitella James V and Zitella Diana M
Bought by
Sansom Kirk
Home Financials for this Owner
Home Financials are based on the most recent Mortgage that was taken out on this home.
Original Mortgage
$85,914
Interest Rate
4.93%
Mortgage Type
FHA
Purchase Details
Closed on
Aug 17, 2007
Sold by
Mortgage Electronic Registration Systems
Bought by
Federal National Mortgage Association
Purchase Details
Closed on
Jul 3, 2007
Sold by
Wooldridge Stephanie
Bought by
Mortgage Electronic Registration Systems
Create a Home Valuation Report for This Property
The Home Valuation Report is an in-depth analysis detailing your home's value as well as a comparison with similar homes in the area
Home Values in the Area
Average Home Value in this Area
Purchase History
| Date | Buyer | Sale Price | Title Company |
|---|---|---|---|
| Quinn Thomas | -- | None Available | |
| Sansom Kirk | -- | None Available | |
| Federal National Mortgage Association | -- | None Available | |
| Mortgage Electronic Registration Systems | -- | None Available |
Source: Public Records
Mortgage History
| Date | Status | Borrower | Loan Amount |
|---|---|---|---|
| Open | Quinn Thomas | $63,254 | |
| Previous Owner | Sansom Kirk | $85,914 |
Source: Public Records
Tax History
| Year | Tax Paid | Tax Assessment Tax Assessment Total Assessment is a certain percentage of the fair market value that is determined by local assessors to be the total taxable value of land and additions on the property. | Land | Improvement |
|---|---|---|---|---|
| 2025 | $2,278 | $38,400 | $3,330 | $35,070 |
| 2024 | $2,064 | $32,490 | $1,670 | $30,820 |
| 2023 | $2,054 | $32,490 | $1,670 | $30,820 |
| 2022 | $1,000 | $18,310 | $1,670 | $16,640 |
| 2021 | $1,000 | $18,310 | $1,670 | $16,640 |
| 2020 | $1,027 | $17,990 | $1,670 | $16,320 |
| 2019 | $998 | $17,990 | $1,670 | $16,320 |
| 2018 | $889 | $16,020 | $1,670 | $14,350 |
| 2017 | $880 | $16,150 | $1,670 | $14,480 |
| 2016 | $885 | $16,150 | $1,670 | $14,480 |
| 2015 | $877 | $16,150 | $1,670 | $14,480 |
| 2014 | $896 | $16,380 | $1,670 | $14,710 |
Source: Public Records
Map
Nearby Homes
- 1149 W Hovey St
- 1026 W Division St
- 1447 N Broadway Ave
- 1105 W Division St
- 1027 W Division St
- 1120 W Hamilton St
- 1450 N Broadway Ave
- 1012 W Hamilton St
- 944 W Division St
- 1056 W Commercial St
- 1305 N Irving Ave
- 1042 W Commercial St
- 1411 W Lynn St
- 1026 W Commercial St
- 1500 W Hamilton St
- 1520 W Lynn St
- 716 W Division St
- 1531 W Hamilton St
- 1535 W Calhoun St
- 723 W Webster St
- 1122 W Hovey St
- 1112 W Hovey St
- 1108 W Hovey St
- 1128 W Hovey St
- 1134 W Hovey St
- 1100 W Hovey St
- 1138 W Hovey St
- 1117 W Lynn St
- 1113 W Lynn St
- 1123 W Lynn St
- 1411 N Franklin Ave
- 1119 W Hovey St
- 1107 W Lynn St
- 1113 W Hovey St
- 1109 W Hovey St
- 1144 W Hovey St
- 1133 W Lynn St
- 1133 W Hovey St
- 1101 W Hovey St
- 1139 W Lynn St
Your Personal Tour Guide
Ask me questions while you tour the home.