NOT LISTED FOR SALE

Estimated Value: $123,000 - $136,000

3 Beds
2 Baths
2,036 Sq Ft
$65/Sq Ft Est. Value

Last Sold August 31, 2017

Last sale price $70,000 $34 Per Sq Ft

Est. 88% increase in value since last sale

Current estimated payment $965/month

About This Home

As of August 2017

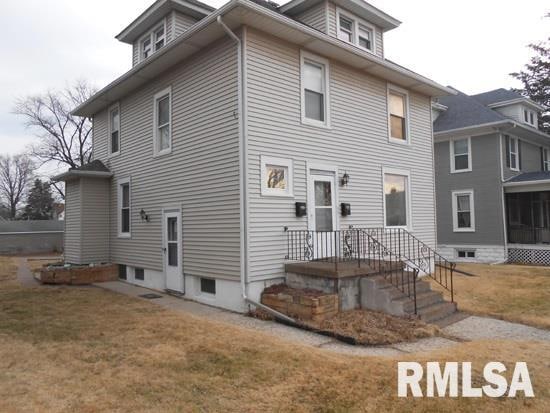
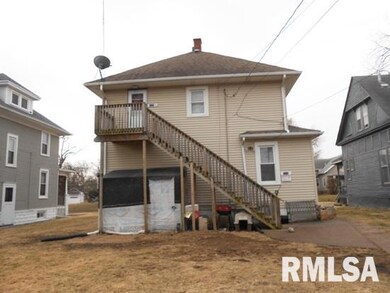
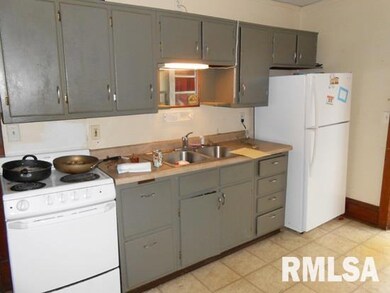
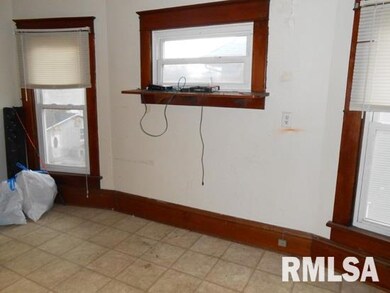
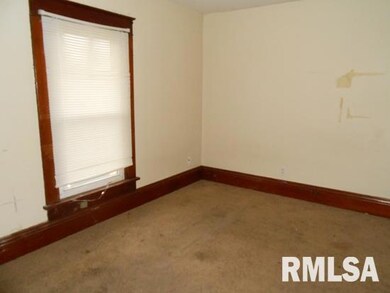
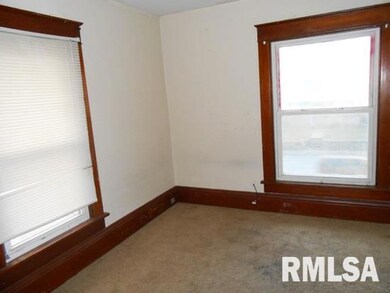
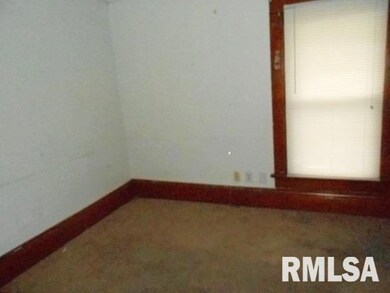
Conveniently located duplex close to schools, doctors, hospital, and city transportation. Strong rental history, but up unit currently vacant. Vinyl siding, replacement windows. Plenty of off street parking. Separate meters for gas and electric. Updated electrical panels. Two water heaters.

Last Listed By

Scott Kelling

Mel Foster Co. Davenport License #B04983000 Listed on: 08/07/2017

Mel Foster Co. Davenport

Property Details

Home Type

  • Multi-Family

Year Built

  • Built in 1900

Lot Details

  • 8,233

Interior Spaces

  • 2-Story Property
  • Basement Fills Entire Space Under The House

Schools

  • Davenport Elementary School
  • Davenport High School

Utilities

  • Cable TV Available

Listing and Financial Details

  • Tenant pays for no utilities

Property Details

Home Type

Multi-Family

Year Built

Built in 1900

Lot Details

0

Listing Details

  • Class: Multi-Family
  • Type: Residential Income
  • Style: 2+ Story
  • Legal Description: Petersen's Addn, Lot 3 BK 2
  • Year Built: 1900
  • Special Features: None
  • Property Sub Type: MultiFamily

Interior Features

  • Interior Amenities: Cable Tv Available
  • Basement: Full
  • Price Per Sq Ft: 34.38
  • Total Sq Ft: 2036

Exterior Features

  • Exterior: Stone
  • Road Access: Paved

Garage/Parking

  • Number Parking Spaces: 4

Utilities

  • Heating Cooling: Forced Air, Gas, Water Heater - Gas
  • Gas Expense: 1212
  • Water Sewer Expenses: 1116

Schools

  • Elementary School: Davenport
  • Middle School: Davenport
  • High School: Davenport
  • Elementary School: Davenport
  • High School: Davenport

Lot Info

  • Estimated Lot Size: 55 X 150
  • Lot Description: Level
  • Subdivision: Petersen
  • Geo Subdivision: IA

Rental Info

  • Tenant Pays: No Utilities
  • Gross Annual Rent Income: 16140

Tax Info

  • Annual Taxes: 1914
  • Parcel Id Number Tax Id: B0064-33
  • Tax Year: 2016

Multi Family

  • Total Number Units: 2
  • Gross Annual Income: 16140
  • Total Number Electric Meters: 2
  • Total Number Gas Meters: 2
  • Total Number Heating Units: 1
  • Total Number Water Heaters: 2
  • Total Number Water Meters: 1

MLS Schools

  • Middle School: Davenport

Ownership History

Date Name Owned For Owner Type

Purchase Details

Listed on
Aug 7, 2017
Closed on
Aug 31, 2017
Sold by
Benson Jeremy R and Benson Gretchen A
Bought by
Agan Shawn L
Seller's Agent
Scott Kelling
Mel Foster Co. Davenport
Buyer's Agent
Scott Kelling
Mel Foster Co. Davenport
List Price
$74,900
Sold Price
$70,000
Premium/Discount to List
-$4,900
-6.54%
Total Days on Market
0
Current Estimated Value
$131,936

Home Financials for this Owner

Home Financials are based on the most recent Mortgage that was taken out on this home.
Estimated Appreciation
$61,936
Avg. Annual Appreciation
6.87%

Purchase Details

Closed on
Aug 25, 2006
Sold by
Luna Dawn D and Luna Daniel T
Bought by
Benson Jeremy R and Benson Gretchen A

Home Financials for this Owner

Home Financials are based on the most recent Mortgage that was taken out on this home.
Original Mortgage
$72,400
Interest Rate
6.88%
Mortgage Type
New Conventional

Range of Values:

Collateral Analytics

Collateral Analytics Collateral Analytics AVMs (Automated Valuation Model) employ a number of statistical approaches combined with neighborhood-specific comparable selection guarantees the most up-to-date and precise valuations.

Not Available

Collateral Analytics does not have data for the current month. Please view the chart for historical values.

ICE

ICE Mortgage Technology ICE Mortgage Technology’s AVM (Automated Valuation Model) is a state-of-the-art online residential property valuation tool that provides a quick and accurate estimate of the value of almost any home in the U.S.

Not Available

ICE Mortgage Technology does not have data for the current month. Please view the chart for historical values.

First American

First American First American Data & Analytics’ next-generation AVM combines unrivaled data assets with a blended ensemble of valuation models to produce highly accurate, reliable valuations you can trust.

Not Available

First American does not have data for the current month. Please view the chart for historical values.

Quantarium

Quantarium Quantarium’s valuation service, repeatedly proven the industry’s most accurate and comprehensive, is supercharged with a self-learning and auto-tuning AI engine that continually becomes smarter and more accurate as it processes daily inputs from the industry’s leading RE data lake.

Not Available

Quantarium does not have data for the current month. Please view the chart for historical values.

Average Value
Not Available
List Price
Sold Price
Create a Home Valuation Report for This Property
The Home Valuation Report is an in-depth analysis detailing your home's value as well as a comparison with similar homes in the area

Home Values in the Area

Source: Public Records

Average Home Value in this Area


Source: Public Records

Purchase History

Date Buyer Sale Price Title Company
Agan Shawn L -- None Available
Benson Jeremy R $90,500 None Available
Source: Public Records

Mortgage History

Date Status Borrower Loan Amount
Open Agan Shawn L $58,225
Previous Owner Benson Jeremy R $72,400
Source: Public Records

Property History

Date Event Price Change Sq Ft Price
08/31/2017 08/31/17 Sold $70,000 -6.5% $34 / Sq Ft
08/07/2017 08/07/17 Pending -- -- --
08/07/2017 08/07/17 For Sale $74,900 -- $37 / Sq Ft
Source: RMLS Alliance

Tax History Compared to Growth

Source: Public Records

Tax History

Year Tax Paid Tax Assessment Tax Assessment Total Assessment is a certain percentage of the fair market value that is determined by local assessors to be the total taxable value of land and additions on the property. Land Improvement
2024 $2,805 $123,270 $23,380 $99,890
2023 $3,273 $123,270 $23,380 $99,890
2022 $3,301 $93,320 $19,250 $74,070
2021 $2,002 $93,320 $19,250 $74,070
2020 $2,088 $88,470 $19,250 $69,220
2019 $2,111 $88,470 $19,250 $69,220
2018 $1,942 $88,470 $19,250 $69,220
2017 $492 $88,470 $19,250 $69,220
2016 $2,482 $84,150 $0 $0
2015 $1,842 $85,270 $0 $0
2014 $1,894 $85,270 $0 $0
2013 $1,862 $0 $0 $0
2012 -- $87,990 $16,780 $71,210
Source: Public Records

Agents Affiliated with this Home

  • Section Image
See All Agents

Map

Source: RMLS Alliance

MLS Number: RMAQC4185177

RMLS Alliance

APN: B0064-35