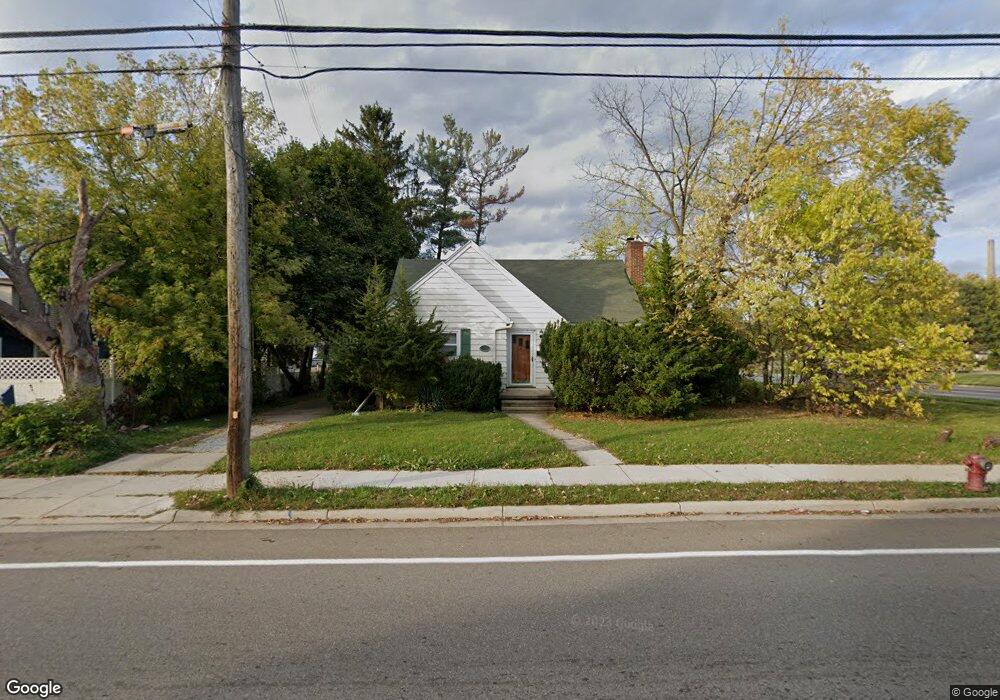
1118 W Mt Hope Lansing, MI 48910
Quentin Park NeighborhoodEstimated Value: $131,000 - $161,000
--
Bed
1
Bath
944
Sq Ft
$153/Sq Ft
Est. Value
About This Home
This home is located at 1118 W Mt Hope, Lansing, MI 48910 and is currently estimated at $144,067, approximately $152 per square foot. 1118 W Mt Hope is a home located in Ingham County with nearby schools including Averill Elementary School, Pattengill Academy, and J.W. Sexton High School.
Ownership History
Date
Name
Owned For
Owner Type
Purchase Details
Closed on
Nov 30, 2015
Sold by
Dl J Mortgage Capital Inc
Bought by
Singh Kulbir
Current Estimated Value
Purchase Details
Closed on
Apr 23, 2015
Sold by
Aldrich Kristooffer S and Aldrich Dakhari
Bought by
Dlj Mortgage Capital Inc
Purchase Details
Closed on
Feb 14, 2007
Sold by
Fannie Mae
Bought by
Aldrich Kris S and Harris James L
Home Financials for this Owner
Home Financials are based on the most recent Mortgage that was taken out on this home.
Original Mortgage
$71,585
Interest Rate
6.28%
Mortgage Type
Purchase Money Mortgage
Purchase Details
Closed on
Apr 4, 2006
Sold by
Mortgage Electronic Registration Systems
Bought by
Federal National Mortgage Association
Purchase Details
Closed on
Mar 23, 2006
Sold by
Moore Daniel
Bought by
Mortgage Electronic Registration Systems
Purchase Details
Closed on
Aug 14, 1996
Sold by
Binkowski Mary and Borzenski Joh
Bought by
Moore Daniel
Create a Home Valuation Report for This Property
The Home Valuation Report is an in-depth analysis detailing your home's value as well as a comparison with similar homes in the area
Home Values in the Area
Average Home Value in this Area
Purchase History
| Date | Buyer | Sale Price | Title Company |
|---|---|---|---|
| Singh Kulbir | $27,000 | Attorneys Title Agency Llc | |
| Dlj Mortgage Capital Inc | $60,867 | None Available | |
| Aldrich Kris S | -- | Fatic | |
| Federal National Mortgage Association | -- | None Available | |
| Mortgage Electronic Registration Systems | $72,072 | None Available | |
| Moore Daniel | $39,900 | -- |
Source: Public Records
Mortgage History
| Date | Status | Borrower | Loan Amount |
|---|---|---|---|
| Previous Owner | Aldrich Kris S | $71,585 |
Source: Public Records
Tax History Compared to Growth
Tax History
| Year | Tax Paid | Tax Assessment Tax Assessment Total Assessment is a certain percentage of the fair market value that is determined by local assessors to be the total taxable value of land and additions on the property. | Land | Improvement |
|---|---|---|---|---|
| 2025 | $3,176 | $61,300 | $11,000 | $50,300 |
| 2024 | $26 | $53,800 | $11,000 | $42,800 |
| 2023 | $2,988 | $48,500 | $11,000 | $37,500 |
| 2022 | $2,728 | $45,600 | $12,300 | $33,300 |
| 2021 | $2,665 | $37,600 | $9,700 | $27,900 |
| 2020 | $2,646 | $35,500 | $9,700 | $25,800 |
| 2019 | $2,557 | $33,100 | $9,700 | $23,400 |
| 2018 | $2,424 | $31,600 | $9,700 | $21,900 |
| 2017 | $2,333 | $31,600 | $9,700 | $21,900 |
| 2016 | $2,554 | $30,400 | $9,700 | $20,700 |
| 2015 | $2,554 | $29,600 | $19,482 | $10,118 |
| 2014 | $2,554 | $29,600 | $22,938 | $6,662 |
Source: Public Records
Map
Nearby Homes
- 1114 Goodrich St
- 1116 George St
- 2001 S Martin Luther King Junior Blvd
- 1312 W Mount Hope Ave
- 1315 Goodrich St
- 2011 S Martin Luther King jr Blvd
- 1913 Stirling Ave
- 1721 Fletcher St
- 2118 Marion Ave
- 2112 Stirling Ave
- 907 Lenore Ave
- 917 W Barnes Ave
- 1010 W Barnes Ave
- 1420 Poxson Ave
- 1309 Hammond St
- 2310 Stirling Ave
- 712 Lenore Ave
- 1120 Kelsey Ave
- 1032 Kelsey Ave
- 1404 Kelsey Ave
- 1118 W Mount Hope Ave
- 1124 W Mt Hope
- 1124 W Mount Hope Ave
- 1119 Goodrich St
- 1115 Goodrich St
- 1128 W Mount Hope Ave
- 1123 Goodrich St
- 1127 Goodrich St
- 16920 W Mount Hope Ave
- 1130 W Mount Hope Ave
- 1123 W Mt Hope Ave
- 1131 Goodrich St
- 1117 W Mount Hope Ave
- 1121 W Mount Hope Ave
- 1202 W Mount Hope Ave
- 1125 W Mount Hope Ave
- 1127 W Mount Hope Ave
- 1205 Goodrich St
- 1206 W Mount Hope Ave
- 1201 W Mount Hope Ave