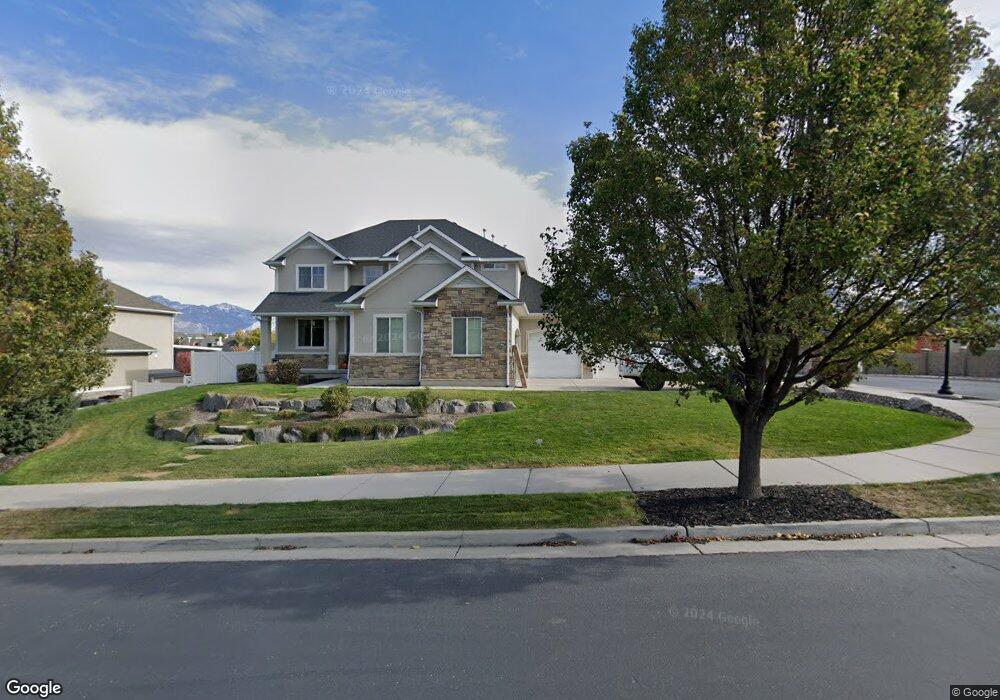
11183 S Miriam Dr South Jordan, UT 84095
Estimated Value: $743,000 - $1,033,273
4
Beds
3
Baths
2,565
Sq Ft
$354/Sq Ft
Est. Value
About This Home
This home is located at 11183 S Miriam Dr, South Jordan, UT 84095 and is currently estimated at $908,818, approximately $354 per square foot. 11183 S Miriam Dr is a home located in Salt Lake County with nearby schools including South Jordan School, South Jordan Middle School, and American Preparatory Academy - Draper 2 Campus.
Ownership History
Date
Name
Owned For
Owner Type
Purchase Details
Closed on
Nov 9, 2010
Sold by
Wright Matthew T
Bought by
Galke Neil A and Galke Jessica L
Current Estimated Value
Home Financials for this Owner
Home Financials are based on the most recent Mortgage that was taken out on this home.
Original Mortgage
$310,944
Outstanding Balance
$205,156
Interest Rate
4.27%
Mortgage Type
New Conventional
Estimated Equity
$703,662
Purchase Details
Closed on
Mar 26, 2010
Sold by
Scenic Development Inc
Bought by
Wright Matthew T
Purchase Details
Closed on
Apr 5, 2007
Sold by
Scenic Holdings Llc
Bought by
Scenic Development Inc
Home Financials for this Owner
Home Financials are based on the most recent Mortgage that was taken out on this home.
Original Mortgage
$1,254,000
Interest Rate
6.16%
Mortgage Type
Purchase Money Mortgage
Create a Home Valuation Report for This Property
The Home Valuation Report is an in-depth analysis detailing your home's value as well as a comparison with similar homes in the area
Home Values in the Area
Average Home Value in this Area
Purchase History
| Date | Buyer | Sale Price | Title Company |
|---|---|---|---|
| Galke Neil A | -- | Metro National Title | |
| Wright Matthew T | -- | Alta Title | |
| Scenic Development Inc | -- | Integrated Title Ins Svcs |
Source: Public Records
Mortgage History
| Date | Status | Borrower | Loan Amount |
|---|---|---|---|
| Open | Galke Neil A | $310,944 | |
| Previous Owner | Scenic Development Inc | $1,254,000 |
Source: Public Records
Tax History Compared to Growth
Tax History
| Year | Tax Paid | Tax Assessment Tax Assessment Total Assessment is a certain percentage of the fair market value that is determined by local assessors to be the total taxable value of land and additions on the property. | Land | Improvement |
|---|---|---|---|---|
| 2025 | $4,406 | $855,200 | $389,400 | $465,800 |
| 2024 | $4,406 | $834,700 | $277,700 | $557,000 |
| 2023 | $4,071 | $727,600 | $261,900 | $465,700 |
| 2022 | $4,346 | $761,400 | $256,800 | $504,600 |
| 2021 | $3,814 | $612,800 | $230,100 | $382,700 |
| 2020 | $3,721 | $560,400 | $187,300 | $373,100 |
| 2019 | $3,750 | $555,200 | $140,200 | $415,000 |
| 2018 | $3,477 | $512,200 | $140,200 | $372,000 |
| 2017 | $3,063 | $442,100 | $140,200 | $301,900 |
| 2016 | $3,339 | $456,700 | $140,200 | $316,500 |
| 2015 | $3,219 | $427,900 | $156,600 | $271,300 |
| 2014 | $3,080 | $402,400 | $148,900 | $253,500 |
Source: Public Records
Map
Nearby Homes
- 11187 S Devon View Dr
- 11324 S Trent Dr
- 456 Aspen Gate Ln
- 11173 S Aspen Peak Dr
- 724 W Maple Drift Ln
- Sonderborg Plan at Big Willow Creek - Collection & Cottage
- Lillehammer Plan at Big Willow Creek - Collection & Cottage
- Nyborg Plan at Big Willow Creek - Collection & Cottage
- Raleigh Traditional Plan at Big Willow Creek
- 498 W Maidengrass Way
- 504 W Maidengrass Way
- 11534 Sweet Grass Ct
- 11552 S Sweet Grass Ct
- 702 W Osborne Fox Way
- Bentley II Plan at Fox Landing
- Crescent Plan at Fox Landing
- Hensley Plan at Fox Landing
- Bayhill Plan at Fox Landing
- Rosamund Plan at Fox Landing
- Midway Plan at Fox Landing
- 11177 S Miriam Oaks Dr Unit 412
- 658 W Cory Rd
- 658 Cory Rd
- 11210 S Brook N Lance
- 602 W Cory Rd S Unit 111
- 11184 S Devon View Dr
- 11172 Miriam Oaks Dr
- 11172 S Miriam Oaks Dr
- 11157 S Miriam Oaks Dr
- 11157 S Miriam Oaks Dr Unit 413
- 11168 Devon View Dr
- 11193 S Gracie View Ln
- 11193 S Gracie View Ln Unit 101
- 11223 S Brook N Lance
- 11223 S Brook N Lance
- 11223 S Brook N Lance
- 678 Cory Rd
- 678 W Cory Rd
- 11147 S Miriam Oaks Dr
- 11173 S Dalton Farm Cove