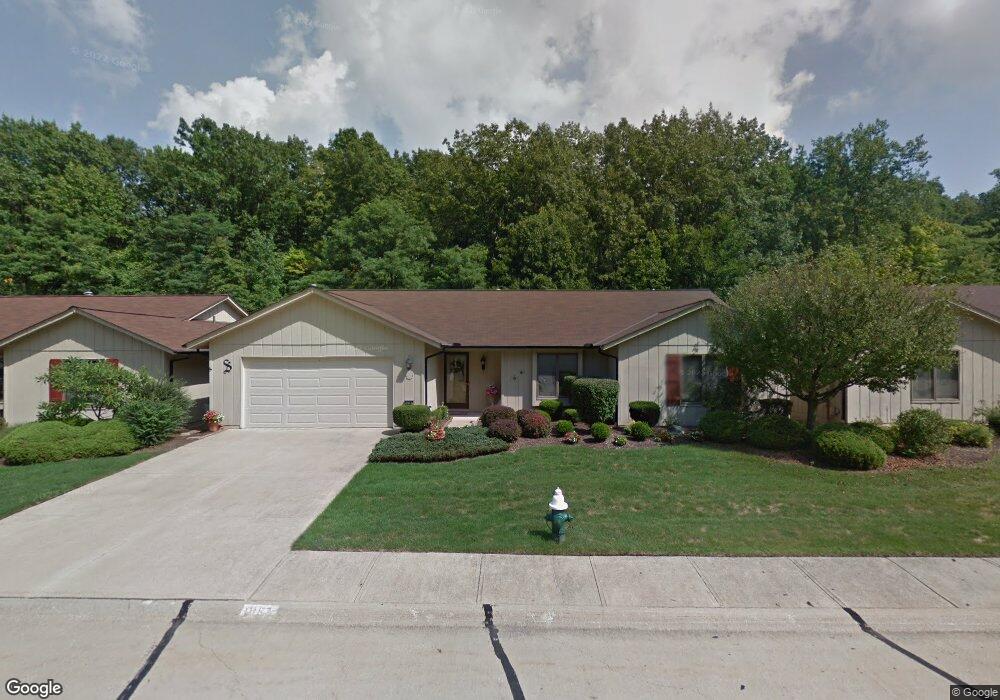
11187 Blodgett Creek Trail Strongsville, OH 44149
Estimated Value: $315,954 - $340,000
3
Beds
3
Baths
1,886
Sq Ft
$173/Sq Ft
Est. Value
About This Home
This home is located at 11187 Blodgett Creek Trail, Strongsville, OH 44149 and is currently estimated at $325,489, approximately $172 per square foot. 11187 Blodgett Creek Trail is a home located in Cuyahoga County with nearby schools including Strongsville High School and Sts Joseph & John Interparochial School.
Ownership History
Date
Name
Owned For
Owner Type
Purchase Details
Closed on
Feb 9, 2018
Sold by
Ivanoyich Maria C
Bought by
Ivanovich Maria C and Maria C Ivanovich Revocable Li
Current Estimated Value
Purchase Details
Closed on
Nov 3, 2016
Sold by
Sidlecki Paulette L
Bought by
Ivanovich Maria C
Home Financials for this Owner
Home Financials are based on the most recent Mortgage that was taken out on this home.
Original Mortgage
$132,000
Outstanding Balance
$107,450
Interest Rate
3.87%
Mortgage Type
Adjustable Rate Mortgage/ARM
Estimated Equity
$218,039
Purchase Details
Closed on
Jun 1, 2001
Sold by
Stiles David W
Bought by
Siedlecki Robert J and Siedlecki Paulette L
Purchase Details
Closed on
Jun 5, 2000
Sold by
Stiles William W
Bought by
Stiles William W
Purchase Details
Closed on
Sep 18, 1989
Sold by
Fannin Bldrs
Bought by
Stiles William W
Purchase Details
Closed on
Jan 1, 1989
Bought by
Fannin Bldrs
Create a Home Valuation Report for This Property
The Home Valuation Report is an in-depth analysis detailing your home's value as well as a comparison with similar homes in the area
Home Values in the Area
Average Home Value in this Area
Purchase History
| Date | Buyer | Sale Price | Title Company |
|---|---|---|---|
| Ivanovich Maria C | -- | None Available | |
| Ivanovich Maria C | $165,000 | Revere Title | |
| Siedlecki Robert J | -- | Chicago Title Insurance Comp | |
| Stiles William W | -- | -- | |
| Stiles William W | $127,400 | -- | |
| Fannin Bldrs | -- | -- |
Source: Public Records
Mortgage History
| Date | Status | Borrower | Loan Amount |
|---|---|---|---|
| Open | Ivanovich Maria C | $132,000 |
Source: Public Records
Tax History Compared to Growth
Tax History
| Year | Tax Paid | Tax Assessment Tax Assessment Total Assessment is a certain percentage of the fair market value that is determined by local assessors to be the total taxable value of land and additions on the property. | Land | Improvement |
|---|---|---|---|---|
| 2024 | $3,538 | $85,155 | $18,480 | $66,675 |
| 2023 | $4,092 | $74,520 | $17,330 | $57,190 |
| 2022 | $4,088 | $74,520 | $17,330 | $57,190 |
| 2021 | $4,056 | $74,520 | $17,330 | $57,190 |
| 2020 | $3,648 | $61,080 | $14,210 | $46,870 |
| 2019 | $3,541 | $174,500 | $40,600 | $133,900 |
| 2018 | $3,214 | $61,080 | $14,210 | $46,870 |
| 2017 | $3,562 | $53,700 | $10,820 | $42,880 |
| 2016 | $2,958 | $53,700 | $10,820 | $42,880 |
| 2015 | $2,928 | $53,700 | $10,820 | $42,880 |
| 2014 | -- | $54,780 | $11,030 | $43,750 |
Source: Public Records
Map
Nearby Homes
- 20050 Idlewood Trail
- 19997 Idlewood Trail
- 19890 Idlewood Trail
- 11179 Fawn Meadow Ln
- 10986 Fawn Meadow Ln
- 20424 Scotch Pine Way
- 20684 Albion Rd
- 19240 Briarwood Ln
- 10839 Prospect Rd
- 11432 Pearl Rd
- 12385 Corinth Ct
- 12647 Edgepark Cir
- 11499 Pearl Rd Unit A106
- 21176 Hickory Branch Trail
- 12694 Ionia Ct
- 12651 Alameda Dr
- 12539 Olympus Way
- 21355 Hickory Branch Trail
- 9401 Pheasant Run Place
- 13066 Olympus Way
- 11169 Blodgett Creek Trail
- 11225 Blodgett Creek Trail
- 11111 Blodgett Creek Trail
- 11194 Blodgett Creek Trail
- 11172 Blodgett Creek Trail
- 11216 Blodgett Creek Trail
- 11293 Blodgett Creek Trail
- 11128 Blodgett Creek Trail
- 11260 Blodgett Creek Trail
- 11106 Blodgett Creek Trail
- 20070 Idlewood Trail
- 20064 Idlewood Trail
- 11282 Blodgett Creek Trail
- 11073 Blodgett Creek Trail
- 20076 Idlewood Trail
- 20060 Idlewood Trail
- 11351 Blodgett Creek Trail
- 11326 Blodgett Creek Trail
- 11040 Blodgett Creek Trail
- 20080 Idlewood Trail