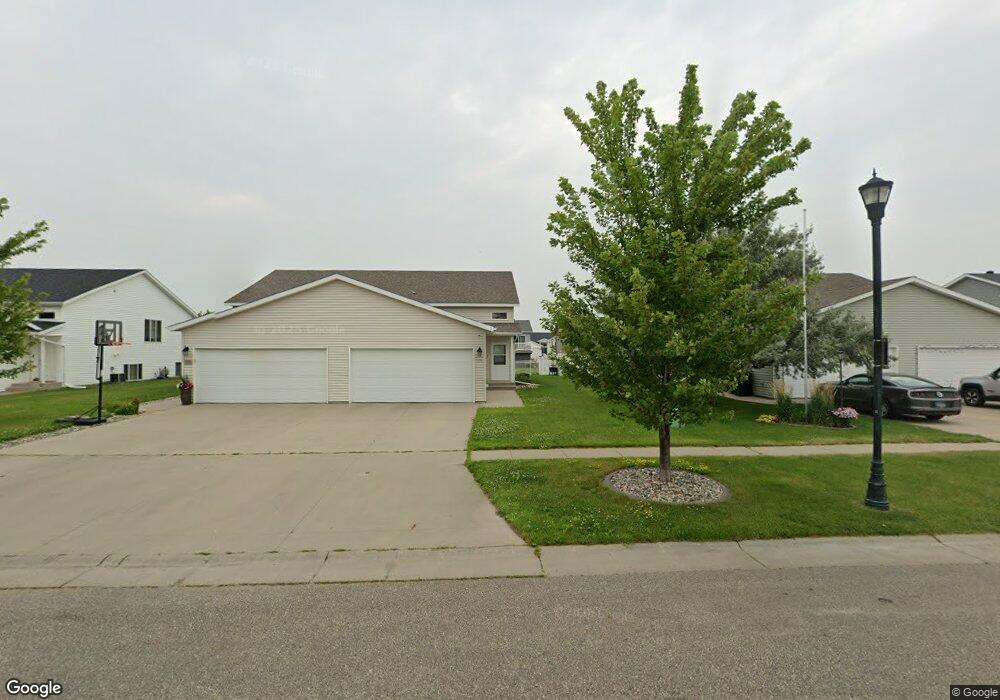
1119 38 1/2 Ave W West Fargo, ND 58078
Eagle Run NeighborhoodEstimated Value: $272,000 - $276,000
3
Beds
2
Baths
1,764
Sq Ft
$155/Sq Ft
Est. Value
About This Home
This home is located at 1119 38 1/2 Ave W, West Fargo, ND 58078 and is currently estimated at $273,989, approximately $155 per square foot. 1119 38 1/2 Ave W is a home located in Cass County with nearby schools including Aurora Elementary School, Liberty Middle School, and West Fargo Sheyenne High School.
Ownership History
Date
Name
Owned For
Owner Type
Purchase Details
Closed on
Mar 5, 2024
Sold by
Grasto Owen Keith and Grasto Erica Ann
Bought by
Grasto Owen Keith and Grasto Erica Ann
Current Estimated Value
Purchase Details
Closed on
Jul 30, 2013
Sold by
Phillips Linda C
Bought by
Henderson Erica A
Home Financials for this Owner
Home Financials are based on the most recent Mortgage that was taken out on this home.
Original Mortgage
$112,000
Interest Rate
3.93%
Mortgage Type
New Conventional
Purchase Details
Closed on
Aug 11, 2008
Sold by
Michel Erick J and Michel Carole B
Bought by
Phillips Linda C
Home Financials for this Owner
Home Financials are based on the most recent Mortgage that was taken out on this home.
Original Mortgage
$118,960
Interest Rate
6.25%
Mortgage Type
FHA
Purchase Details
Closed on
Mar 28, 2006
Sold by
Michel Eric and Michel Carole B
Bought by
Michel Eric J and Michel Carole B
Purchase Details
Closed on
Aug 5, 2005
Sold by
Jordahl Custom Homes Inc
Bought by
Michel Eric
Home Financials for this Owner
Home Financials are based on the most recent Mortgage that was taken out on this home.
Original Mortgage
$95,350
Interest Rate
5.71%
Mortgage Type
New Conventional
Create a Home Valuation Report for This Property
The Home Valuation Report is an in-depth analysis detailing your home's value as well as a comparison with similar homes in the area
Home Values in the Area
Average Home Value in this Area
Purchase History
| Date | Buyer | Sale Price | Title Company |
|---|---|---|---|
| Grasto Owen Keith | -- | Fm Title | |
| Henderson Erica A | $140,000 | Fm Title | |
| Phillips Linda C | -- | -- | |
| Michel Eric J | -- | -- | |
| Michel Eric | -- | -- |
Source: Public Records
Mortgage History
| Date | Status | Borrower | Loan Amount |
|---|---|---|---|
| Previous Owner | Henderson Erica A | $112,000 | |
| Previous Owner | Phillips Linda C | $118,960 | |
| Previous Owner | Michel Eric | $95,350 |
Source: Public Records
Tax History Compared to Growth
Tax History
| Year | Tax Paid | Tax Assessment Tax Assessment Total Assessment is a certain percentage of the fair market value that is determined by local assessors to be the total taxable value of land and additions on the property. | Land | Improvement |
|---|---|---|---|---|
| 2024 | $3,238 | $123,600 | $18,800 | $104,800 |
| 2023 | $3,624 | $119,000 | $18,800 | $100,200 |
| 2022 | $3,312 | $106,100 | $18,800 | $87,300 |
| 2021 | $3,064 | $97,400 | $14,100 | $83,300 |
| 2020 | $2,934 | $94,300 | $14,100 | $80,200 |
| 2019 | $2,941 | $91,300 | $14,100 | $77,200 |
| 2018 | $3,511 | $90,600 | $14,100 | $76,500 |
| 2017 | $3,401 | $87,850 | $14,100 | $73,750 |
| 2016 | $3,180 | $85,600 | $14,100 | $71,500 |
| 2015 | $3,106 | $74,650 | $5,900 | $68,750 |
| 2014 | $3,118 | $69,750 | $5,900 | $63,850 |
| 2013 | $3,055 | $66,150 | $5,900 | $60,250 |
Source: Public Records
Map
Nearby Homes
- 1040 39th Ave W
- 909 38 1 2 Ave W
- 1156 42nd Ave W Unit A
- 1054 42nd Ave W
- 3662 N Sedona Ct
- 1236 S Beach Way
- 1168 43rd Ave W
- 1381 Westport Beach Way
- 4509 11th St W
- 4507 Newport Ln
- 4534 Westport Pkwy
- 4717 11th St W
- 945 31st Ave W
- 4757 11th St W
- 922 31st Ave W
- 1097 Hickory Ln
- 1089 Hickory Ln
- 1082 Larkin Ln
- 1015 29th Ave W
- 1052 50th Ave W
- 1119 38 1 2 Ave W
- 1123 38 1/2 Ave W
- 1115 38 1/2 Ave W
- 1123 38 1 2 Ave W
- 1127 38 1 2 Ave W
- 1111 38 1 2 Ave W
- 1111 38 1/2 Ave W
- 1127 38 1/2 Ave W
- 1059 38 1 2 Ave W
- 1059 38 1/2 Ave W
- 1131 38 1/2 Ave W
- 1112 39th Ave W
- 1118 39th Ave W
- 1055 38 1 2 Ave W
- 1055 38 1/2 Ave W
- 1135 38 1/2 Ave W
- 1124 39th Ave W
- 1106 39th Ave W
- 1052 39 Ave W
- 1051 38 1/2 Ave W