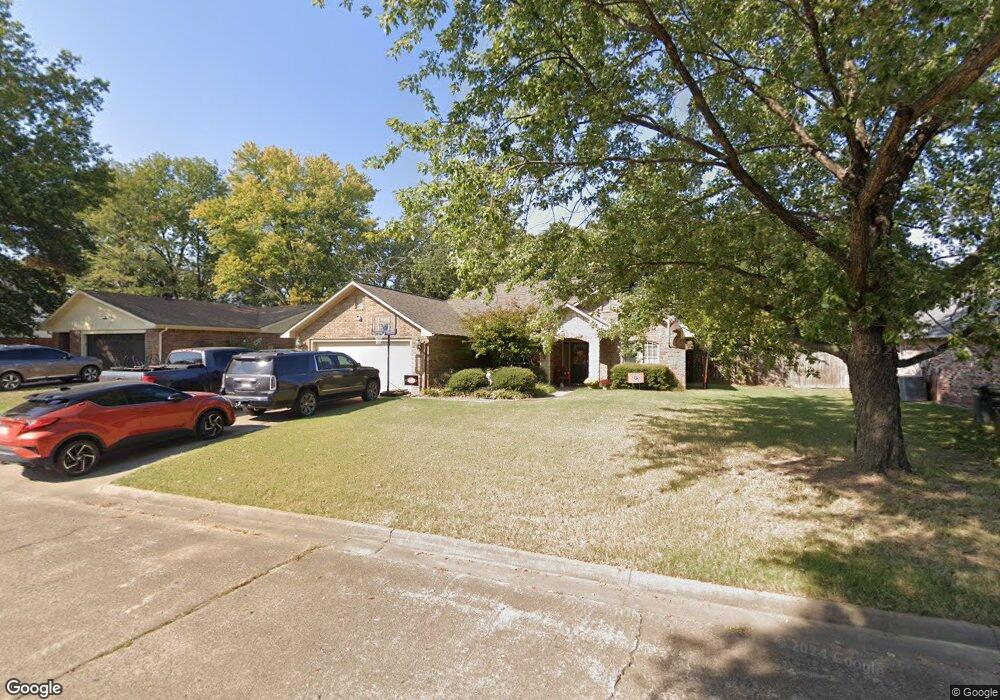
1119 Alex Denton Dr Sallisaw, OK 74955
Estimated Value: $221,000 - $285,000
3
Beds
2
Baths
1,683
Sq Ft
$146/Sq Ft
Est. Value
About This Home
This home is located at 1119 Alex Denton Dr, Sallisaw, OK 74955 and is currently estimated at $245,962, approximately $146 per square foot. 1119 Alex Denton Dr is a home located in Sequoyah County with nearby schools including Liberty Elementary School, Eastside Elementary School, and Sallisaw Middle School.
Ownership History
Date
Name
Owned For
Owner Type
Purchase Details
Closed on
Oct 26, 2022
Sold by
Wilson Ryan K
Bought by
Wilson Ryan K and Wilson Sarah R
Current Estimated Value
Home Financials for this Owner
Home Financials are based on the most recent Mortgage that was taken out on this home.
Original Mortgage
$163,680
Outstanding Balance
$158,577
Interest Rate
6.92%
Mortgage Type
VA
Estimated Equity
$87,385
Purchase Details
Closed on
Oct 8, 2009
Sold by
Caughman Jill L and Caughman Patrick D
Bought by
Wilson Ryan K
Home Financials for this Owner
Home Financials are based on the most recent Mortgage that was taken out on this home.
Original Mortgage
$136,734
Interest Rate
5.16%
Mortgage Type
New Conventional
Purchase Details
Closed on
Mar 15, 2007
Sold by
Idavid Graham Construction Llc
Bought by
Canghaman Jill
Home Financials for this Owner
Home Financials are based on the most recent Mortgage that was taken out on this home.
Original Mortgage
$976,000
Interest Rate
6.3%
Mortgage Type
New Conventional
Create a Home Valuation Report for This Property
The Home Valuation Report is an in-depth analysis detailing your home's value as well as a comparison with similar homes in the area
Home Values in the Area
Average Home Value in this Area
Purchase History
| Date | Buyer | Sale Price | Title Company |
|---|---|---|---|
| Wilson Ryan K | -- | Servicelink | |
| Wilson Ryan K | $127,000 | None Available | |
| Canghaman Jill | $93,000 | None Available |
Source: Public Records
Mortgage History
| Date | Status | Borrower | Loan Amount |
|---|---|---|---|
| Open | Wilson Ryan K | $163,680 | |
| Previous Owner | Wilson Ryan K | $136,734 | |
| Previous Owner | Canghaman Jill | $976,000 |
Source: Public Records
Tax History Compared to Growth
Tax History
| Year | Tax Paid | Tax Assessment Tax Assessment Total Assessment is a certain percentage of the fair market value that is determined by local assessors to be the total taxable value of land and additions on the property. | Land | Improvement |
|---|---|---|---|---|
| 2024 | $1,767 | $20,446 | $1,980 | $18,466 |
| 2023 | $1,767 | $19,850 | $1,980 | $17,870 |
| 2022 | $1,558 | $19,272 | $1,980 | $17,292 |
| 2021 | $1,544 | $19,272 | $1,980 | $17,292 |
| 2020 | $1,524 | $18,581 | $1,899 | $16,682 |
| 2019 | $1,493 | $18,040 | $1,836 | $16,204 |
| 2018 | $1,459 | $17,515 | $1,603 | $15,912 |
| 2017 | $1,411 | $17,004 | $1,427 | $15,577 |
| 2016 | $1,383 | $16,509 | $1,385 | $15,124 |
| 2015 | $1,365 | $16,027 | $1,344 | $14,683 |
| 2014 | $1,322 | $15,561 | $1,305 | $14,256 |
Source: Public Records
Map
Nearby Homes
- 414 N Dogwood St
- 402 N Dogwood St
- 406 N Dogwood St
- TBD Mitchell St
- 320 N Dogwood St
- 1122 Green St
- 611 E Wilshire Blvd
- 412 Ridge Dr
- 1408 Lessley Ln
- 830 E Chickasaw Place
- 701 E Chickasaw Ave
- 504 E Choctaw Ave
- 831 E Mary Ave
- 1605 Preakness Place
- 409 E Choctaw Ave
- 1705 E Fryar Dr
- 300 S Fryar Dr
- 703 E Ida Ave
- 0 Rural Route Unit 2535327
- 400 S Fryar Dr
- 1119 Alex Denton Dr
- 1115 Alex Denton Dr
- 1201 Alex Denton Dr
- 000 Belle Denton Cir
- 1109 Alex Denton Dr
- 1203 Alex Denton Dr
- 1107 Alex Denton Dr
- 706 Belle Denton Cir
- 810 Melba Denton Ln
- 804 Melba Denton Ln
- 1206 Alex Denton Dr
- 1104 Alex Denton Dr
- 1301 Alex Denton Dr
- 1015 E Redwood Ave
- 1015 E Redwood Ave
- 712 Melba Denton Ln
- 712 Melba Denton Ln
- 712 Melba Denton Ln
- 712 Melba Denton Ln
- 712 Melba Denton Ln