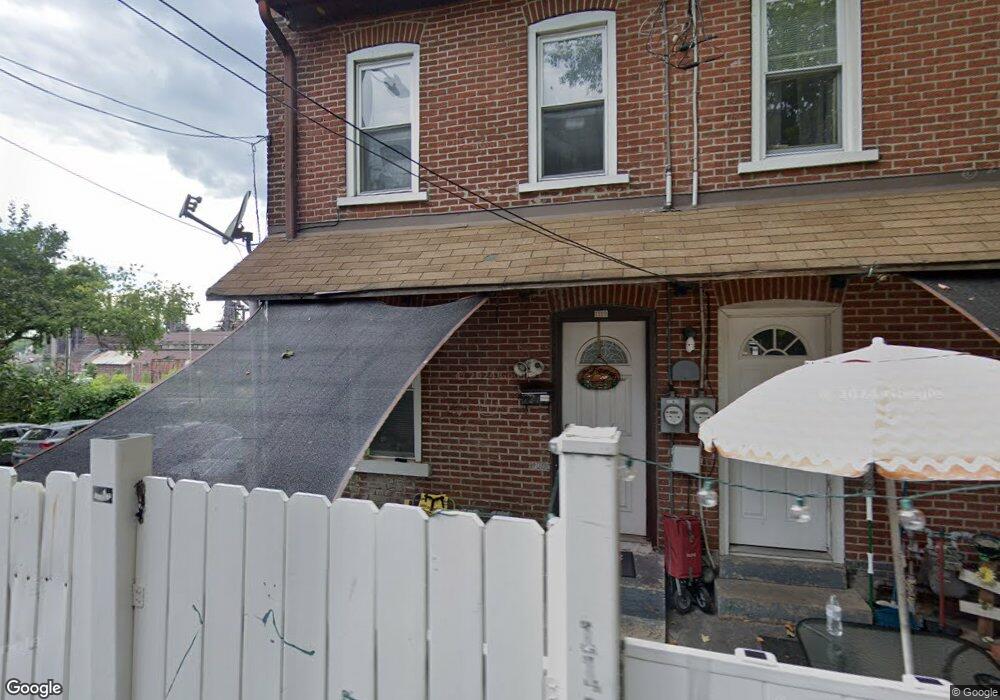
1119 Amplex St Bethlehem, PA 18015
Downtown Bethlehem NeighborhoodEstimated Value: $144,000 - $175,000
2
Beds
2
Baths
1,120
Sq Ft
$146/Sq Ft
Est. Value
About This Home
This home is located at 1119 Amplex St, Bethlehem, PA 18015 and is currently estimated at $163,315, approximately $145 per square foot. 1119 Amplex St is a home located in Northampton County with nearby schools including Donegan Elementary School, Broughal Middle School, and Freedom High School.
Ownership History
Date
Name
Owned For
Owner Type
Purchase Details
Closed on
Jun 29, 2012
Sold by
The Estate Of Raymond Gonzales
Bought by
Gonzales Catherine
Current Estimated Value
Purchase Details
Closed on
Nov 10, 2011
Sold by
Gonzales Raymond
Bought by
Gonzales Raymond
Purchase Details
Closed on
May 20, 2009
Sold by
Peter Halikoutakis
Bought by
Gonzales Raymond
Purchase Details
Closed on
Oct 24, 2007
Sold by
Peter Halikoutakis
Bought by
Gonzales Raymond
Create a Home Valuation Report for This Property
The Home Valuation Report is an in-depth analysis detailing your home's value as well as a comparison with similar homes in the area
Home Values in the Area
Average Home Value in this Area
Purchase History
| Date | Buyer | Sale Price | Title Company |
|---|---|---|---|
| Gonzales Catherine | -- | None Available | |
| Gonzales Raymond | -- | None Available | |
| Gonzales Raymond | -- | None Available | |
| Gonzales Raymond | $45,000 | None Available | |
| Gonzales Raymond | $45,000 | -- |
Source: Public Records
Tax History
| Year | Tax Paid | Tax Assessment Tax Assessment Total Assessment is a certain percentage of the fair market value that is determined by local assessors to be the total taxable value of land and additions on the property. | Land | Improvement |
|---|---|---|---|---|
| 2025 | $225 | $20,800 | $4,000 | $16,800 |
| 2024 | $1,839 | $20,800 | $4,000 | $16,800 |
| 2023 | $1,839 | $20,800 | $4,000 | $16,800 |
| 2022 | $1,824 | $20,800 | $4,000 | $16,800 |
| 2021 | $1,812 | $20,800 | $4,000 | $16,800 |
| 2020 | $1,795 | $20,800 | $4,000 | $16,800 |
| 2019 | $3,362 | $20,800 | $4,000 | $16,800 |
| 2018 | $1,745 | $20,800 | $4,000 | $16,800 |
| 2017 | $332 | $4,000 | $4,000 | $0 |
| 2016 | -- | $4,000 | $4,000 | $0 |
| 2015 | -- | $4,000 | $4,000 | $0 |
| 2014 | -- | $4,000 | $4,000 | $0 |
Source: Public Records
Map
Nearby Homes
Your Personal Tour Guide
Ask me questions while you tour the home.