Estimated Value: $517,000 - $744,195
3
Beds
4
Baths
3,074
Sq Ft
$206/Sq Ft
Est. Value
About This Home
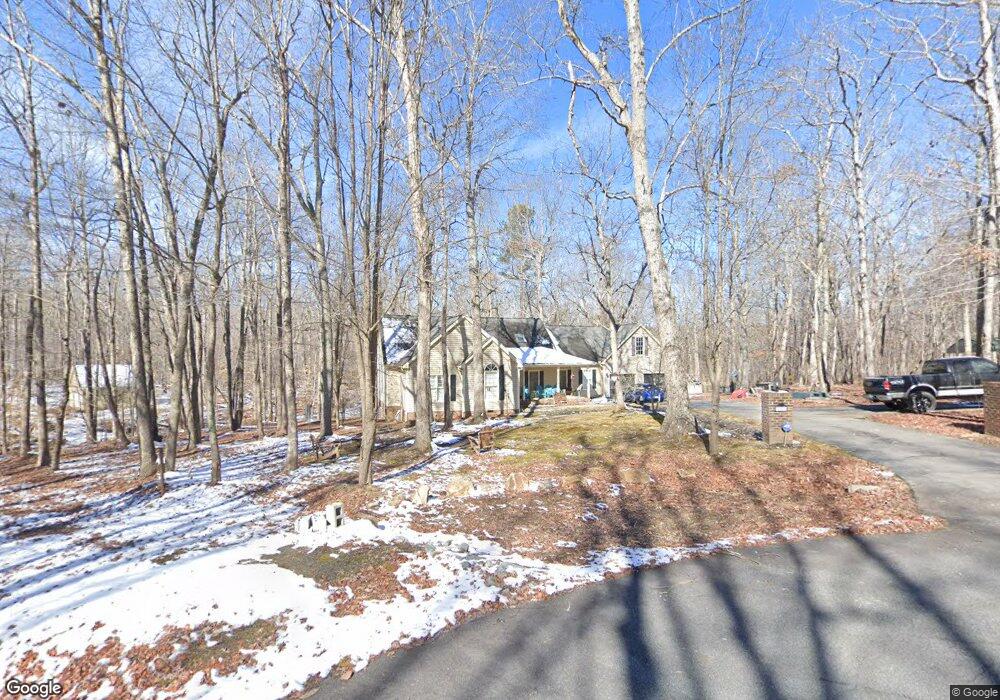
This home is located at 1119 Bowling Mountain Dr, Stem, NC 27581 and is currently estimated at $633,799, approximately $206 per square foot. 1119 Bowling Mountain Dr is a home located in Granville County with nearby schools including West Oxford Elementary School, Butner-Stem Middle School, and Granville Central High School.
Ownership History
Date
Name
Owned For
Owner Type
Purchase Details
Closed on
Jan 21, 2014
Sold by
Ample Financial Services Llc
Bought by
Corgan Marguerite R
Current Estimated Value
Home Financials for this Owner
Home Financials are based on the most recent Mortgage that was taken out on this home.
Original Mortgage
$62,500
Outstanding Balance
$47,274
Interest Rate
4.44%
Mortgage Type
Purchase Money Mortgage
Estimated Equity
$586,525
Purchase Details
Closed on
Jan 15, 2014
Sold by
Citifinancial Services Inc
Bought by
Ample Financial Services Llc
Home Financials for this Owner
Home Financials are based on the most recent Mortgage that was taken out on this home.
Original Mortgage
$62,500
Outstanding Balance
$47,274
Interest Rate
4.44%
Mortgage Type
Purchase Money Mortgage
Estimated Equity
$586,525
Purchase Details
Closed on
Aug 6, 2013
Sold by
Bass James K and Bass Susan W
Bought by
Citifinancial Services Inc
Create a Home Valuation Report for This Property
The Home Valuation Report is an in-depth analysis detailing your home's value as well as a comparison with similar homes in the area
Purchase History
| Date | Buyer | Sale Price | Title Company |
|---|---|---|---|
| Corgan Marguerite R | $162,500 | None Available | |
| Ample Financial Services Llc | $157,500 | None Available | |
| Citifinancial Services Inc | $172,818 | None Available |
Source: Public Records
Mortgage History
| Date | Status | Borrower | Loan Amount |
|---|---|---|---|
| Open | Corgan Marguerite R | $62,500 |
Source: Public Records
Tax History
| Year | Tax Paid | Tax Assessment Tax Assessment Total Assessment is a certain percentage of the fair market value that is determined by local assessors to be the total taxable value of land and additions on the property. | Land | Improvement |
|---|---|---|---|---|
| 2025 | $4,538 | $647,192 | $83,875 | $563,317 |
| 2024 | $4,538 | $647,192 | $83,875 | $563,317 |
| 2023 | $2,847 | $307,786 | $48,065 | $259,721 |
| 2022 | $2,869 | $307,786 | $48,065 | $259,721 |
| 2021 | $2,679 | $307,786 | $48,065 | $259,721 |
| 2020 | $2,679 | $307,786 | $48,065 | $259,721 |
| 2019 | $2,679 | $307,786 | $48,065 | $259,721 |
| 2018 | $2,679 | $307,786 | $48,065 | $259,721 |
| 2016 | $2,640 | $289,325 | $49,475 | $239,850 |
| 2015 | $2,490 | $289,325 | $49,475 | $239,850 |
| 2014 | $2,490 | $289,325 | $49,475 | $239,850 |
| 2013 | -- | $289,325 | $49,475 | $239,850 |
Source: Public Records
Map
Nearby Homes
- 1664 Garrett Farm Rd
- 1652 Garrett Farm Rd
- 1658 Garrett Farm Rd
- The Cameron- Value Series Plan at Murphy's Ridge - Value Series
- The Belmont I Lifestyle Series Plan at Murphy's Ridge - Lifestyle Series
- The Laurel- Lifestyle Series Plan at Murphy's Ridge - Lifestyle Series
- The Hamilton Value Series Plan at Murphy's Ridge - Value Series
- The Linville- Lifestyle Series Plan at Murphy's Ridge - Lifestyle Series
- The Parmele- Lifestyle Series Plan at Murphy's Ridge - Lifestyle Series
- The Southport- Value Series Plan at Murphy's Ridge - Value Series
- The Belmont II- Value Series Plan at Murphy's Ridge - Value Series
- The Hamilton Lifestyle Series Plan at Murphy's Ridge - Lifestyle Series
- The Newport- Value Series Plan at Murphy's Ridge - Value Series
- The Laurel- Value Series Plan at Murphy's Ridge - Value Series
- The Belmont II- Lifestyle Series Plan at Murphy's Ridge - Lifestyle Series
- The Parmele- Value Series Plan at Murphy's Ridge - Value Series
- The Mebane- Value Series Plan at Murphy's Ridge - Value Series
- The Belmont I- Value Series Plan at Murphy's Ridge - Value Series
- The Kenley-Value Series Plan at Murphy's Ridge - Value Series
- The Cypress Lifestyle Series Plan at Murphy's Ridge - Lifestyle Series
- 1123 Bowling Mountain Dr
- 1120 Bowling Mountain Dr
- 1124 Bowling Mountain Dr
- 1125 Bowling Mountain Dr
- 1128 Bowling Mountain Dr
- LOT 8 A Bowling Mountain Dr
- LOT 4 Bowling Mountain Dr
- LOT 6 Bowling Mountain Dr
- LOT 5 Bowling Mountain Dr
- LOT 7 Bowling Mountain Dr
- LOT 11 Bowling Mountain Dr
- LOT 16 Bowling Mountain Dr
- LOT 15 Bowling Mountain Dr
- 0 Bowling Mountain Dr Unit 1771601
- 0 Bowling Mountain Dr Unit 1855576
- LOT8 A Bowling Mountain Dr
- Lot 6R Bowling Mountain Dr
- Lot 8B Bowling Mountain Dr
- LT 6 Bowling Mountain Dr
- 0 Bowling Mountain Dr Unit 7 TR1855576
Your Personal Tour Guide
Ask me questions while you tour the home.