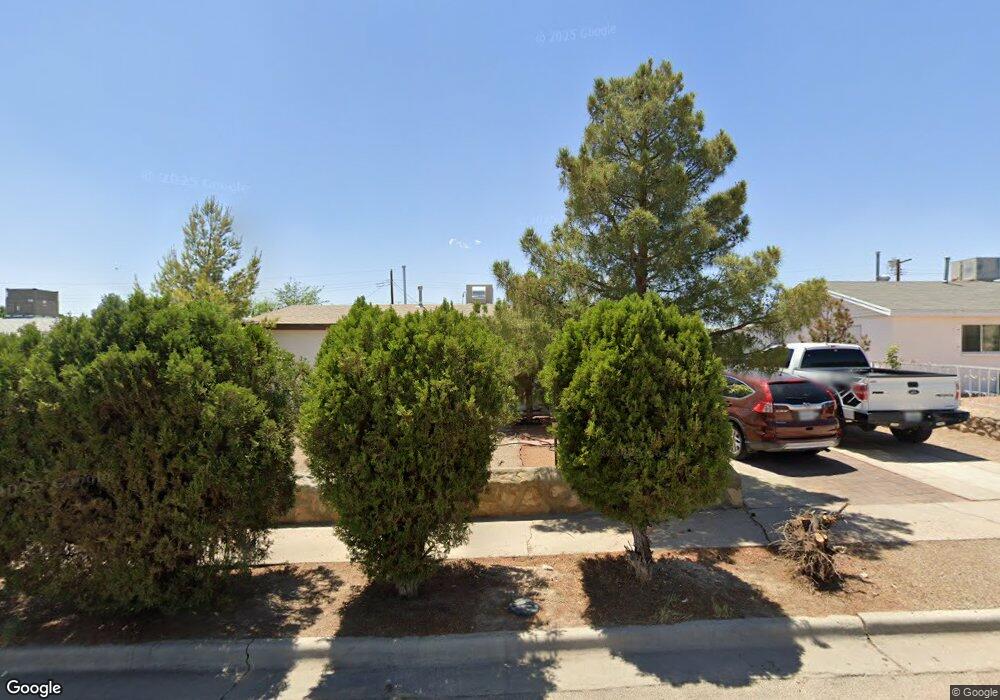
1119 Cimarron St El Paso, TX 79915
Ranchland East NeighborhoodEstimated Value: $129,000 - $149,000
--
Bed
2
Baths
1,118
Sq Ft
$128/Sq Ft
Est. Value
About This Home
This home is located at 1119 Cimarron St, El Paso, TX 79915 and is currently estimated at $142,614, approximately $127 per square foot. 1119 Cimarron St is a home located in El Paso County with nearby schools including Hacienda Heights Elementary School, North Loop Elementary School, and Bel Air Middle.
Ownership History
Date
Name
Owned For
Owner Type
Purchase Details
Closed on
Dec 16, 2013
Sold by
Fuentes Luis Antonio
Bought by
Madrid Sylvia Guadalupe
Current Estimated Value
Home Financials for this Owner
Home Financials are based on the most recent Mortgage that was taken out on this home.
Original Mortgage
$40,000
Outstanding Balance
$29,897
Interest Rate
4.21%
Mortgage Type
New Conventional
Estimated Equity
$112,717
Purchase Details
Closed on
Oct 17, 2013
Sold by
Salazar Maria Yvonne and Aguirre Sylvia Fuentes
Bought by
Fuentes Luis Antonio
Home Financials for this Owner
Home Financials are based on the most recent Mortgage that was taken out on this home.
Original Mortgage
$40,000
Outstanding Balance
$29,897
Interest Rate
4.21%
Mortgage Type
New Conventional
Estimated Equity
$112,717
Purchase Details
Closed on
Jun 6, 2013
Sold by
Fuentes Emilia
Bought by
Fuentes Luis Antonio
Create a Home Valuation Report for This Property
The Home Valuation Report is an in-depth analysis detailing your home's value as well as a comparison with similar homes in the area
Home Values in the Area
Average Home Value in this Area
Purchase History
| Date | Buyer | Sale Price | Title Company |
|---|---|---|---|
| Madrid Sylvia Guadalupe | -- | None Available | |
| Fuentes Luis Antonio | -- | None Available | |
| Fuentes Luis Antonio | -- | None Available |
Source: Public Records
Mortgage History
| Date | Status | Borrower | Loan Amount |
|---|---|---|---|
| Open | Madrid Sylvia Guadalupe | $40,000 |
Source: Public Records
Tax History Compared to Growth
Tax History
| Year | Tax Paid | Tax Assessment Tax Assessment Total Assessment is a certain percentage of the fair market value that is determined by local assessors to be the total taxable value of land and additions on the property. | Land | Improvement |
|---|---|---|---|---|
| 2025 | $1,620 | $121,934 | -- | -- |
| 2024 | $1,620 | $110,849 | -- | -- |
| 2023 | $1,578 | $100,772 | $0 | $0 |
| 2022 | $2,845 | $91,611 | $0 | $0 |
| 2021 | $2,707 | $83,283 | $16,239 | $67,044 |
| 2020 | $2,482 | $78,579 | $16,239 | $62,340 |
| 2018 | $2,632 | $84,644 | $16,239 | $68,405 |
| 2017 | $2,358 | $77,128 | $16,239 | $60,889 |
| 2016 | $2,358 | $77,128 | $16,239 | $60,889 |
| 2015 | $1,783 | $77,128 | $16,239 | $60,889 |
| 2014 | $1,783 | $78,973 | $16,239 | $62,734 |
Source: Public Records
Map
Nearby Homes
- 1121 Belen Rd
- 7564 Matamoros Dr
- 1124 Hunter Dr
- 7622 Matamoros Dr
- 7534 Taxco Dr
- 7761 Maverick Ave
- 7713 Matamoros Dr
- 7718 Parral Dr
- 7542 Hermosillo Dr
- 1207 Bois d Arc Dr
- 7832 Ranchland Dr
- 7403 Mojave Dr
- 7315 Mojave Dr
- 844 Santa Barbara Dr
- 7921 Candlewood Ave
- 7655 Hacienda Ave
- 812 Santa Barbara Dr
- 7936 Dogwood St
- 7922 Parral Dr
- 3 Atkinson Way
- 1117 Cimarron St
- 1121 Cimarron St
- 1118 Belen Rd
- 1115 Cimarron St
- 1116 Belen Rd
- 1120 Belen Rd
- 1118 Cimarron St
- 1114 Belen Rd
- 1116 Cimarron St
- 1120 Cimarron St
- 1125 Cimarron St
- 1113 Cimarron St
- 1114 Cimarron St
- 1124 Belen Rd
- 1112 Belen Rd
- 1124 Cimarron St
- 1112 Cimarron St
- 1111 Cimarron St
- 1127 Cimarron St
- 1119 Prescott Dr