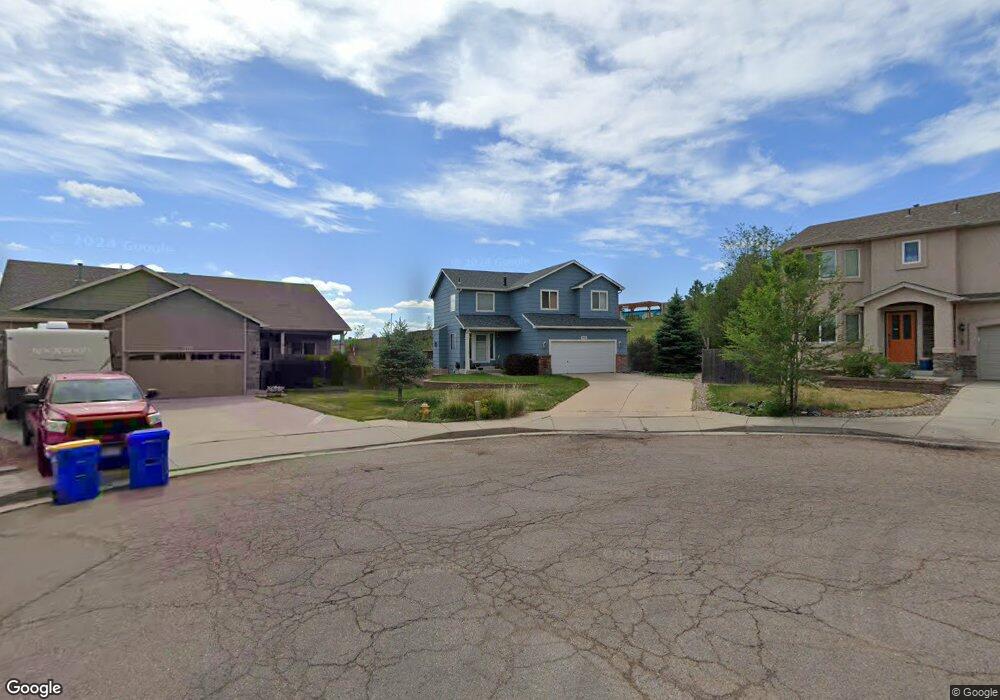
1119 Hill Mesa Ct Colorado Springs, CO 80905
Gold Hill Mesa NeighborhoodEstimated Value: $546,999 - $608,000
4
Beds
3
Baths
1,578
Sq Ft
$368/Sq Ft
Est. Value
About This Home
This home is located at 1119 Hill Mesa Ct, Colorado Springs, CO 80905 and is currently estimated at $580,500, approximately $367 per square foot. 1119 Hill Mesa Ct is a home located in El Paso County with nearby schools including Midland Elementary School, West Middle School, and Coronado High School.
Ownership History
Date
Name
Owned For
Owner Type
Purchase Details
Closed on
Dec 30, 2005
Sold by
Escobar Gregory P and Escobar Erin M
Bought by
Laycock Brian
Current Estimated Value
Home Financials for this Owner
Home Financials are based on the most recent Mortgage that was taken out on this home.
Original Mortgage
$205,600
Outstanding Balance
$115,289
Interest Rate
6.23%
Mortgage Type
Fannie Mae Freddie Mac
Estimated Equity
$465,211
Purchase Details
Closed on
May 16, 2003
Sold by
Feature Homes Inc
Bought by
Escobar Erin M and Escobar Gregory P
Home Financials for this Owner
Home Financials are based on the most recent Mortgage that was taken out on this home.
Original Mortgage
$214,261
Interest Rate
5.79%
Mortgage Type
VA
Purchase Details
Closed on
Dec 30, 2002
Sold by
Crown Hill Llc
Bought by
Feature Homes Inc
Home Financials for this Owner
Home Financials are based on the most recent Mortgage that was taken out on this home.
Original Mortgage
$184,000
Interest Rate
6.16%
Create a Home Valuation Report for This Property
The Home Valuation Report is an in-depth analysis detailing your home's value as well as a comparison with similar homes in the area
Home Values in the Area
Average Home Value in this Area
Purchase History
| Date | Buyer | Sale Price | Title Company |
|---|---|---|---|
| Laycock Brian | $257,000 | Security Title | |
| Escobar Erin M | $222,212 | Unified Title Co Inc | |
| Feature Homes Inc | $51,000 | Unified Title Co Inc |
Source: Public Records
Mortgage History
| Date | Status | Borrower | Loan Amount |
|---|---|---|---|
| Open | Laycock Brian | $205,600 | |
| Previous Owner | Escobar Erin M | $214,261 | |
| Previous Owner | Feature Homes Inc | $184,000 |
Source: Public Records
Tax History Compared to Growth
Tax History
| Year | Tax Paid | Tax Assessment Tax Assessment Total Assessment is a certain percentage of the fair market value that is determined by local assessors to be the total taxable value of land and additions on the property. | Land | Improvement |
|---|---|---|---|---|
| 2025 | $1,749 | $38,920 | -- | -- |
| 2024 | $1,632 | $35,920 | $5,530 | $30,390 |
| 2023 | $1,632 | $35,920 | $5,530 | $30,390 |
| 2022 | $1,370 | $24,480 | $5,210 | $19,270 |
| 2021 | $1,486 | $25,180 | $5,360 | $19,820 |
| 2020 | $1,571 | $23,150 | $4,610 | $18,540 |
| 2019 | $1,563 | $23,150 | $4,610 | $18,540 |
| 2018 | $1,534 | $20,910 | $4,210 | $16,700 |
| 2017 | $1,453 | $20,910 | $4,210 | $16,700 |
| 2016 | $1,166 | $20,120 | $4,140 | $15,980 |
| 2015 | $1,162 | $20,120 | $4,140 | $15,980 |
| 2014 | $1,101 | $18,290 | $4,140 | $14,150 |
Source: Public Records
Map
Nearby Homes
- 1443 W Costilla St
- 924 W Cimarron St
- 1595 W Costilla St
- 1145 Lady Campbell Dr
- 145 S Olympian Dr
- 133 S Olympian Dr
- 151 Mayflower St
- 293 S Raven Mine Dr
- 253 S Raven Mine Dr
- 134 Mayflower St
- 227 S Raven Mine Dr Unit 227
- 80 S Olympian Dr
- 254 S Raven Mine Dr
- 0 W Moreno Ave
- 1173 Solitaire St
- 1191 Solitaire St
- 1341 Solitaire St
- 907 W Cucharras St
- 58 N Olympian Dr
- 1590 Little Bear Creek Point Unit 2
- 1111 Hill Mesa Ct
- 1127 Hill Mesa Ct
- 1135 Hill Mesa Ct
- 1120 W Moreno Ave
- 1118 Hill Mesa Ct
- 1143 Hill Mesa Ct
- 1126 Hill Mesa Ct
- 1134 Hill Mesa Ct
- 1151 Hill Mesa Ct
- 1142 Hill Mesa Ct
- 1150 Hill Mesa Ct
- 1159 Hill Mesa Ct
- 1158 Hill Mesa Ct
- 1167 Hill Mesa Ct
- 514 S 11th St
- 1166 Hill Mesa Ct
- 1211 W Costilla St
- 506 S 11th St
- 1175 Hill Mesa Ct
- 502 S 11th St