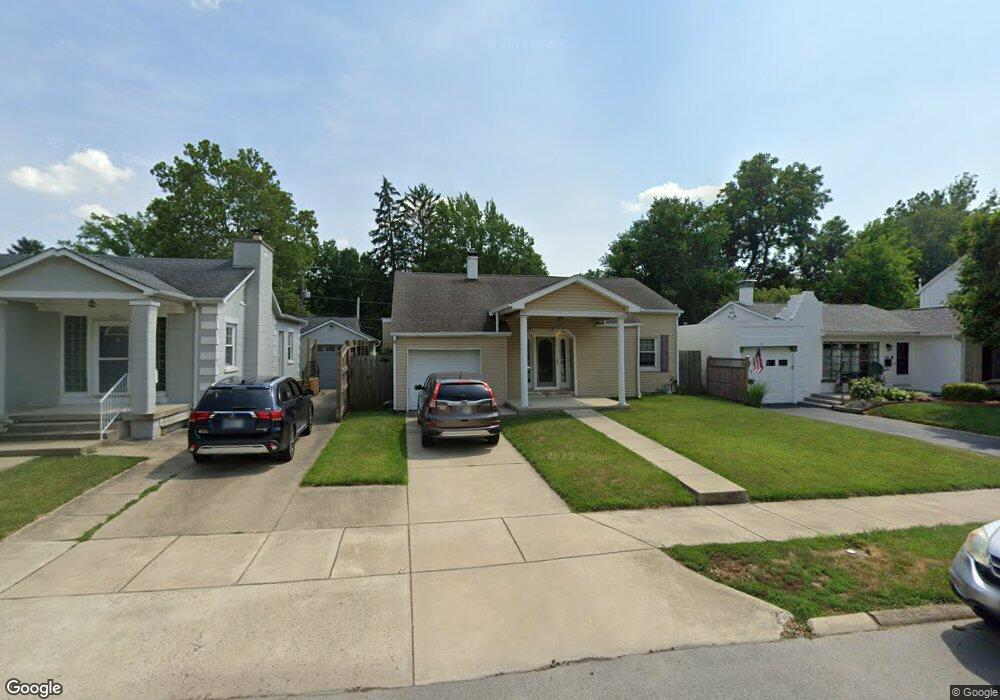
1119 King St Lafayette, IN 47905
Central NeighborhoodEstimated Value: $261,000 - $337,000
--
Bed
--
Bath
2,180
Sq Ft
$131/Sq Ft
Est. Value
About This Home
This home is located at 1119 King St, Lafayette, IN 47905 and is currently estimated at $286,429, approximately $131 per square foot. 1119 King St is a home located in Tippecanoe County with nearby schools including Oakland Elementary School, Lafayette Tecumseh Junior High School, and Sunnyside Intermediate School.
Ownership History
Date
Name
Owned For
Owner Type
Purchase Details
Closed on
Jun 30, 2004
Sold by
Middleton Barbara
Bought by
Linville Joseph R and Linville Teresa K
Current Estimated Value
Home Financials for this Owner
Home Financials are based on the most recent Mortgage that was taken out on this home.
Original Mortgage
$101,600
Outstanding Balance
$50,065
Interest Rate
6.12%
Mortgage Type
Purchase Money Mortgage
Estimated Equity
$236,364
Purchase Details
Closed on
Jun 11, 2004
Sold by
Middleton D Lynn
Bought by
Linville Joseph R and Linville Teresa K
Home Financials for this Owner
Home Financials are based on the most recent Mortgage that was taken out on this home.
Original Mortgage
$101,600
Outstanding Balance
$50,065
Interest Rate
6.12%
Mortgage Type
Purchase Money Mortgage
Estimated Equity
$236,364
Create a Home Valuation Report for This Property
The Home Valuation Report is an in-depth analysis detailing your home's value as well as a comparison with similar homes in the area
Home Values in the Area
Average Home Value in this Area
Purchase History
| Date | Buyer | Sale Price | Title Company |
|---|---|---|---|
| Linville Joseph R | -- | Poelstra Title Company | |
| Linville Joseph R | -- | Poelstra Title Company |
Source: Public Records
Mortgage History
| Date | Status | Borrower | Loan Amount |
|---|---|---|---|
| Open | Linville Joseph R | $101,600 | |
| Closed | Linville Joseph R | $15,030 |
Source: Public Records
Tax History Compared to Growth
Tax History
| Year | Tax Paid | Tax Assessment Tax Assessment Total Assessment is a certain percentage of the fair market value that is determined by local assessors to be the total taxable value of land and additions on the property. | Land | Improvement |
|---|---|---|---|---|
| 2024 | $4,350 | $217,500 | $26,000 | $191,500 |
| 2023 | $4,122 | $206,100 | $26,000 | $180,100 |
| 2022 | $3,504 | $175,200 | $26,000 | $149,200 |
| 2021 | $2,990 | $149,500 | $26,000 | $123,500 |
| 2020 | $2,714 | $135,700 | $26,000 | $109,700 |
| 2019 | $2,508 | $125,400 | $20,000 | $105,400 |
| 2018 | $2,388 | $119,400 | $20,000 | $99,400 |
| 2017 | $2,294 | $114,700 | $20,000 | $94,700 |
| 2016 | $641 | $113,000 | $20,000 | $93,000 |
| 2014 | $518 | $105,200 | $20,000 | $85,200 |
| 2013 | $497 | $104,200 | $20,000 | $84,200 |
Source: Public Records
Map
Nearby Homes
- 1214 King St
- 900 King St
- 1226 Sinton Ave
- 1318 Sinton Ave
- 1111 S 14th St
- 1108 Potomac Ave
- 1204 Central St
- 1501 El Prado Ave
- 1501 Franklin St
- 804 S 10th St
- 1639 Stanforth Ave
- 602 Cherokee Ave
- 1406 Virginia St
- 1422 Virginia St
- 619 S 10th St
- 867 Shawnee Ave
- 701 Kossuth St
- 1511 Kossuth St
- 912 Crestview Place
- 2060 Crestview Ct