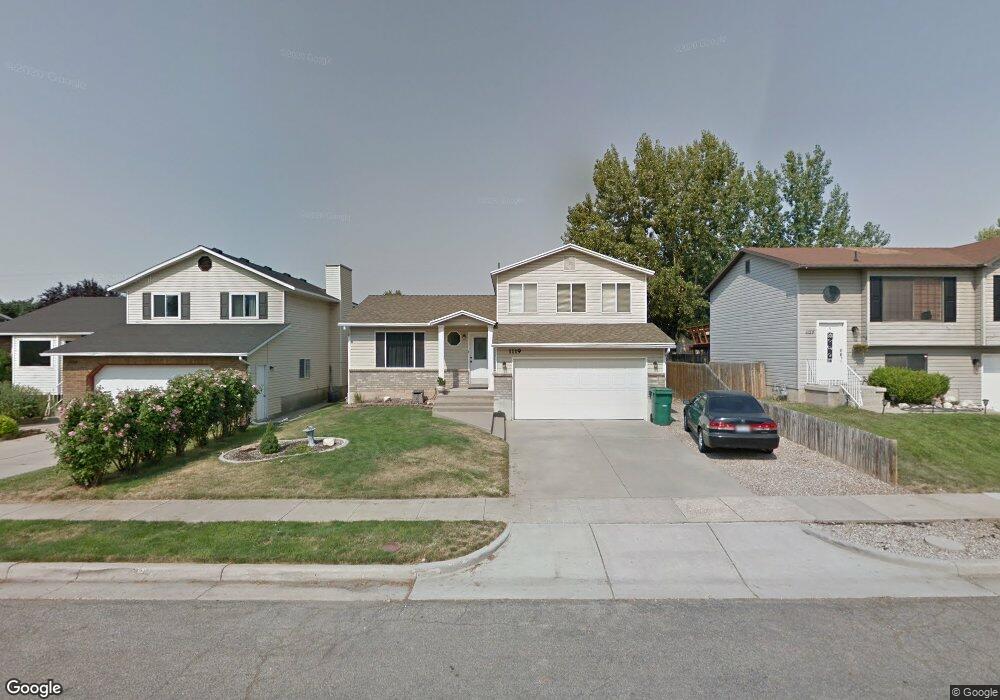
1119 N 250 W Layton, UT 84041
Estimated Value: $427,887 - $444,000
3
Beds
3
Baths
1,460
Sq Ft
$298/Sq Ft
Est. Value
About This Home
This home is located at 1119 N 250 W, Layton, UT 84041 and is currently estimated at $435,722, approximately $298 per square foot. 1119 N 250 W is a home located in Davis County with nearby schools including Crestview Elementary School, Central Davis Junior High School, and Northridge High School.
Ownership History
Date
Name
Owned For
Owner Type
Purchase Details
Closed on
Feb 24, 2021
Sold by
Myoral Ed Brandon
Bought by
Myoral Ed Brandon
Current Estimated Value
Home Financials for this Owner
Home Financials are based on the most recent Mortgage that was taken out on this home.
Original Mortgage
$173,500
Outstanding Balance
$155,177
Interest Rate
2.7%
Mortgage Type
New Conventional
Estimated Equity
$280,545
Purchase Details
Closed on
Oct 18, 2016
Sold by
Child Samuel R and Child Kolleen A
Bought by
Myoral Ed Brandon
Purchase Details
Closed on
Feb 7, 2014
Sold by
Dj Chapman Enterprise Llc
Bought by
Child Samuel R and Child Kolleen A
Home Financials for this Owner
Home Financials are based on the most recent Mortgage that was taken out on this home.
Original Mortgage
$6,250
Interest Rate
4.46%
Mortgage Type
Stand Alone Second
Purchase Details
Closed on
Jun 22, 2011
Sold by
Chapman Dawn E
Bought by
Dj Chapman Enterprise Llc
Purchase Details
Closed on
Jun 17, 2011
Sold by
The Secretary Of Housing & Urban Develop
Bought by
Chapman Dawn E
Purchase Details
Closed on
Feb 18, 2011
Sold by
Wells Fargo Bank N A
Bought by
Secretary Of Housing & Urban Development
Purchase Details
Closed on
Nov 17, 2010
Sold by
Federal National Mortgage Association
Bought by
Wells Fargo Bank N A
Purchase Details
Closed on
Oct 22, 2010
Sold by
Jackson George A
Bought by
Federal National Mortgage Association
Purchase Details
Closed on
Oct 20, 2000
Sold by
Macon Peter S
Bought by
Jackson George A
Home Financials for this Owner
Home Financials are based on the most recent Mortgage that was taken out on this home.
Original Mortgage
$143,814
Interest Rate
7.89%
Mortgage Type
FHA
Purchase Details
Closed on
Dec 11, 1998
Sold by
Macon Peter Shawn
Bought by
Macon Peter S
Home Financials for this Owner
Home Financials are based on the most recent Mortgage that was taken out on this home.
Original Mortgage
$112,300
Interest Rate
6.86%
Purchase Details
Closed on
Dec 23, 1996
Sold by
Macon Peter Shawn
Bought by
Macon Peter Shawn
Home Financials for this Owner
Home Financials are based on the most recent Mortgage that was taken out on this home.
Original Mortgage
$110,210
Interest Rate
7.59%
Mortgage Type
FHA
Create a Home Valuation Report for This Property
The Home Valuation Report is an in-depth analysis detailing your home's value as well as a comparison with similar homes in the area
Home Values in the Area
Average Home Value in this Area
Purchase History
| Date | Buyer | Sale Price | Title Company |
|---|---|---|---|
| Myoral Ed Brandon | -- | Intermountain Title | |
| Myoral Ed Brandon | -- | Old Republic Title | |
| Child Samuel R | -- | Backman Title Servic | |
| Dj Chapman Enterprise Llc | -- | Monument Title Ins Inc | |
| Chapman Dawn E | -- | Monument Title Ins In | |
| Secretary Of Housing & Urban Development | -- | Inwest Title Services Inc | |
| Wells Fargo Bank N A | -- | Etitle Insurance Agency | |
| Federal National Mortgage Association | $180,744 | Etitle Insurance Agency | |
| Jackson George A | -- | Backman Stewart Title Servic | |
| Macon Peter S | -- | Associated Title Company | |
| Macon Peter Shawn | -- | First American Title Co |
Source: Public Records
Mortgage History
| Date | Status | Borrower | Loan Amount |
|---|---|---|---|
| Open | Myoral Ed Brandon | $173,500 | |
| Previous Owner | Child Samuel R | $6,250 | |
| Previous Owner | Jackson George A | $143,814 | |
| Previous Owner | Macon Peter S | $112,300 | |
| Previous Owner | Macon Peter Shawn | $110,210 |
Source: Public Records
Tax History Compared to Growth
Tax History
| Year | Tax Paid | Tax Assessment Tax Assessment Total Assessment is a certain percentage of the fair market value that is determined by local assessors to be the total taxable value of land and additions on the property. | Land | Improvement |
|---|---|---|---|---|
| 2025 | $2,059 | $216,150 | $87,361 | $128,789 |
| 2024 | $1,966 | $207,900 | $102,610 | $105,290 |
| 2023 | $1,969 | $367,000 | $129,836 | $237,164 |
| 2022 | $2,021 | $204,600 | $66,274 | $138,326 |
| 2021 | $1,822 | $275,000 | $86,997 | $188,003 |
| 2020 | $1,643 | $238,000 | $75,671 | $162,329 |
| 2019 | $1,622 | $230,000 | $74,193 | $155,807 |
| 2018 | $1,440 | $205,000 | $74,193 | $130,807 |
| 2016 | $1,256 | $92,290 | $22,084 | $70,206 |
| 2015 | $1,288 | $89,815 | $22,084 | $67,731 |
| 2014 | $1,350 | $96,276 | $22,084 | $74,192 |
| 2013 | -- | $77,123 | $19,034 | $58,089 |
Source: Public Records
Map
Nearby Homes