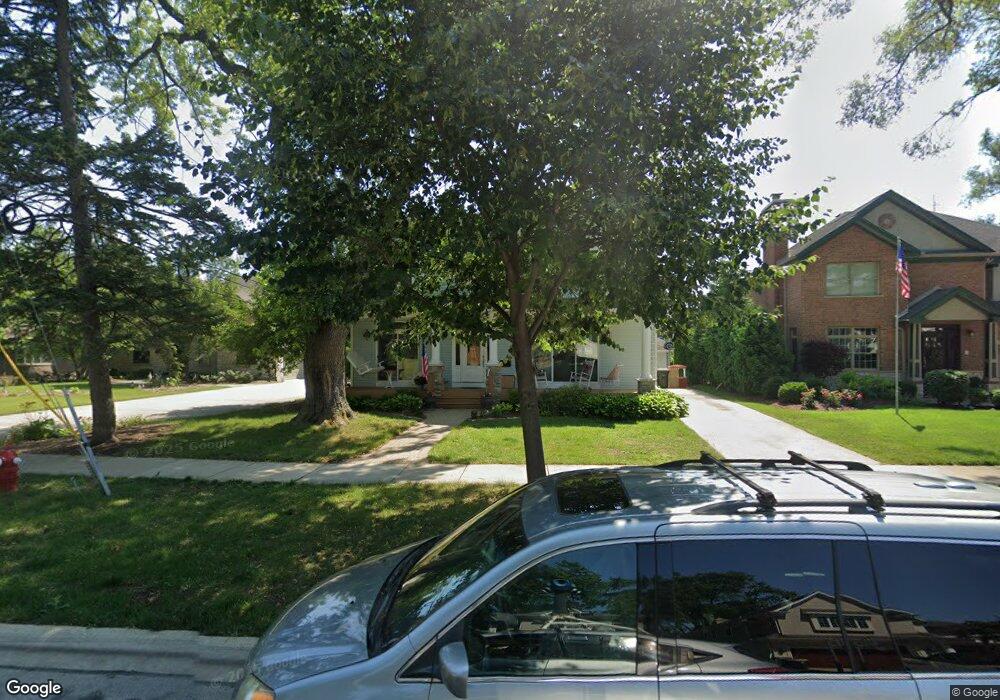
1119 N Belmont Ave Arlington Heights, IL 60004
Estimated Value: $711,000 - $858,000
4
Beds
3
Baths
2,384
Sq Ft
$336/Sq Ft
Est. Value
About This Home
This home is located at 1119 N Belmont Ave, Arlington Heights, IL 60004 and is currently estimated at $801,551, approximately $336 per square foot. 1119 N Belmont Ave is a home located in Cook County with nearby schools including Olive-Mary Stitt Elementary School, Thomas Middle School, and John Hersey High School.
Ownership History
Date
Name
Owned For
Owner Type
Purchase Details
Closed on
Jul 22, 2003
Sold by
Antuma Melanie M
Bought by
Antuma Melanie M and Young Robert M
Current Estimated Value
Home Financials for this Owner
Home Financials are based on the most recent Mortgage that was taken out on this home.
Original Mortgage
$137,000
Interest Rate
5.31%
Mortgage Type
Unknown
Purchase Details
Closed on
Sep 19, 2002
Sold by
Antuma Melanie and Young Robert M
Bought by
Antuma Melanie M
Home Financials for this Owner
Home Financials are based on the most recent Mortgage that was taken out on this home.
Original Mortgage
$141,000
Interest Rate
6.34%
Purchase Details
Closed on
May 13, 2002
Sold by
Young Robert M and Young Alice R
Bought by
Antuma Melanie and Young Robert M
Home Financials for this Owner
Home Financials are based on the most recent Mortgage that was taken out on this home.
Original Mortgage
$141,000
Interest Rate
6.87%
Purchase Details
Closed on
Sep 27, 1999
Sold by
Shaw Otto E and Shaw Doris T
Bought by
Young Robert M and Young Alice R
Home Financials for this Owner
Home Financials are based on the most recent Mortgage that was taken out on this home.
Original Mortgage
$143,450
Interest Rate
7.75%
Create a Home Valuation Report for This Property
The Home Valuation Report is an in-depth analysis detailing your home's value as well as a comparison with similar homes in the area
Home Values in the Area
Average Home Value in this Area
Purchase History
| Date | Buyer | Sale Price | Title Company |
|---|---|---|---|
| Antuma Melanie M | -- | Metropolitan Title Co | |
| Antuma Melanie M | -- | -- | |
| Antuma Melanie | -- | -- | |
| Young Robert M | $185,000 | -- |
Source: Public Records
Mortgage History
| Date | Status | Borrower | Loan Amount |
|---|---|---|---|
| Closed | Antuma Melanie M | $137,000 | |
| Closed | Antuma Melanie M | $141,000 | |
| Closed | Antuma Melanie | $141,000 | |
| Closed | Young Robert M | $143,450 |
Source: Public Records
Tax History Compared to Growth
Tax History
| Year | Tax Paid | Tax Assessment Tax Assessment Total Assessment is a certain percentage of the fair market value that is determined by local assessors to be the total taxable value of land and additions on the property. | Land | Improvement |
|---|---|---|---|---|
| 2024 | $15,597 | $60,287 | $9,150 | $51,137 |
| 2023 | $14,993 | $60,287 | $9,150 | $51,137 |
| 2022 | $14,993 | $60,287 | $9,150 | $51,137 |
| 2021 | $13,384 | $47,792 | $5,718 | $42,074 |
| 2020 | $13,105 | $47,792 | $5,718 | $42,074 |
| 2019 | $14,031 | $56,871 | $5,718 | $51,153 |
| 2018 | $12,988 | $47,944 | $5,032 | $42,912 |
| 2017 | $12,853 | $47,944 | $5,032 | $42,912 |
| 2016 | $12,224 | $47,944 | $5,032 | $42,912 |
| 2015 | $13,086 | $46,941 | $4,346 | $42,595 |
| 2014 | $12,719 | $46,941 | $4,346 | $42,595 |
| 2013 | $4,922 | $18,487 | $4,346 | $14,141 |
Source: Public Records
Map
Nearby Homes
- 703 N Arlington Heights Rd
- 910 N Chestnut Ave
- 1142 N Mitchell Ave
- 1317 N Mitchell Ave
- 1136 N Walnut Ave
- 827 N Walnut Ave
- 415 N Haddow Ave
- 1237 N Ridge Ave
- 1653 N Belmont Ct Unit 31
- 1670 N Douglas Ct Unit 86
- 1605 E Frederick St
- 1504 E Olive St
- 1511 N Windsor Dr Unit 208
- 201 N Vail Ave Unit 305
- 1101 N Stratford Rd
- 104 N Pine Ave Unit 505
- 104 N Pine Ave Unit 302
- 1510 N Kendal Ct Unit 11510
- 1633 N Windsor Dr Unit 113
- 32 N Belmont Ave
- 1115 N Belmont Ave
- 1123 N Belmont Ave
- 1111 N Belmont Ave
- 1116 N Haddow Ave
- 1131 N Belmont Ave
- 1103 N Belmont Ave
- 1124 N Belmont Ave
- 1120 N Belmont Ave
- 408 E Oakton St
- 1116 N Belmont Ave
- 1120 N Haddow Ave
- 1112 N Belmont Ave
- 1139 N Belmont Ave
- 1104 N Haddow Ave
- 1104 N Belmont Ave
- 311 E Clarendon St
- 1117 N Haddow Ave
- 308 E Oakton St
- 1145 N Belmont Ave
- 307 E Clarendon St